Seqanswers Leaderboard Ad

Collapse

Announcement

Collapse
No announcement yet.
X
 
  • Filter
  • Time
  • Show
Clear All
new posts

  • #46
    Originally posted by Maayanster View Post
    I'm trying to figure out which expression quantification program to integrate into the RNA analysis pipeline at my centre.

    Since the review by Garber et al. in Nature Methods (June 2011), and the review by Martin and Wang in Nature Reviews (October 2011), there has been a veritable flood of new tools, particularly in the category of transcriptome reconstruction and isoform expression quantification.

    From reading those reviews and a quick search through pubmed, I compiled the following list of programs that are capable of giving transcript-level expression information as of December 2012:


    Scripture
    Cufflinks
    MMSEQ
    Alexa-Seq
    MISO
    IsoLasso
    CEM
    cuffdiff 2
    RSEM
    FDM
    IsoformEx
    NSMAP
    IQSEQ
    DEXSeq
    DSGSeq
    IsoEM
    IsoInfer
    iReckon
    BitSeq
    eXpress
    SLIDE
    DiffSplice

    This doesn't include tools like DESeq, EdgeR and baySeq that supply only gene-level differential expression.

    I've started reading some of the papers for these tools, but honestly, without that much background in statistics, their relative advantages/disadvantages are pretty opaque. There's discussion in these papers of approaches to normalize various biases, handling biological replicates, handling longer read sizes, and providing information on gene- transcript- and in some cases exon-levels.

    Anyone have advice or comments about any/all of these new choices?

    UPDATE: see below for posts with my impressions of the tools that I've chosen to test out. Learning a lot!

    We argue that you do not have to perform transcript/isoform level analysis if the purpose of your analysis is to find genes that change in different conditions (such as knockout and wildtype). As long as you get the read counts for genes using for example a total exon model, you will be able to use the state of the art statistical programs (such as edgeR, limma ...) to perform differential expression analysis. See the Discussion in our latest publication (http://nar.oxfordjournals.org/conten...kt214.abstract).

    Cheers,
    Wei

    Comment


    • #47
      As far as I know, only two methods for de novo transcriptome assembly obtain alternative isoforms and quantify them, Trinity and TransAbyss. There is also kissplice, which calculates the novo alternative splicing events from read data and without a reference:

      The rapid evolution of DNA sequencing technologies over the past 20 years has made it possible to generate enormous amounts of data, and has subsequently spurred the development of computational tools needed to assemble complete genomes and to analyze genomic, transcriptomic and proteomic data. The GSC collaborates with and supports research by the wider research community. We have an extensive collection of software packages developed in-house available for download here and through GitHub.


      Other methods may provide some sort of quantification but I could see clearly how it is defined. In any case, it's hard to quantify correctly in de novo transcriptome assembly, let alone isoform identification. See e.g. recent preprint by Titus Brown http://arxiv.org/abs/1303.2411

      There are some hybrid approaches that may improve this, like in a paper
      by Birzele et al. 2010

      Eduardo

      Comment


      • #48
        Really lost. Too many tools.

        Comment


        • #49
          Originally posted by fabrice View Post
          Really lost. Too many tools.
          Trying our best to make sense of it.
          Would It help if I put all the summaries and the diagram in one post?


          Regarding isoform quantification that can be used with de novo assembled transcriptomes:
          I think you can assemble using Trans-Abyss, and then use that with the reference based programs that use alignments to the transcriptome like RSEM, BitSeq or eXpress.

          Comment


          • #50
            Thank you.

            I think it will be helpful.

            I want to detect different splicing event in two different conditions. Have good suggestions?

            Anyone try SplicingCompass: http://www.ichip.de/software/SplicingCompass.html

            It is published on 2013.

            I just think the latest should have some advantage.

            Originally posted by Maayanster View Post
            Trying our best to make sense of it.
            Would It help if I put all the summaries and the diagram in one post?


            Regarding isoform quantification that can be used with de novo assembled transcriptomes:
            I think you can assemble using Trans-Abyss, and then use that with the reference based programs that use alignments to the transcriptome like RSEM, BitSeq or eXpress.

            Comment


            • #51
              I've updated the table with methods here:


              It now includes SplicingCompass and PASTA, a recent method for spliced mapping

              Comment


              • #52
                Originally posted by EduEyras View Post
                I've updated the table with methods here:


                It now includes SplicingCompass and PASTA, a recent method for spliced mapping
                Thanks Eduardo, I was precisely wondering about the last update (maybe you could add the info on the page). See you soon

                Comment


                • #53
                  Originally posted by EduEyras View Post
                  I've updated the table with methods here:


                  It now includes SplicingCompass and PASTA, a recent method for spliced mapping
                  That sounds a useful resource. You may be interested in adding Subread and Subjunc into your tables as well.

                  Subread is a splicing-aware read mapper. It can map both RNA-seq and gDNA-seq reads. Subjunc is a exon-exon junction detector, but it maps reads as well. These two programs can be accessed from sourceforge: http://subread.sourceforge.net/

                  The Rsubread Bioconductor/R package (http://bioconductor.org/packages/rel.../Rsubread.html) provides R interface to Subread and Subjunc, and it also includes a read summarization function called 'featureCounts' that can be used to quantify expression levels of genes and exons.

                  Subread and Subjunc compare favorably with competing aligners and junction detectors. For more details, please refer to: http://www.ncbi.nlm.nih.gov/pubmed/23558742

                  Cheers
                  Wei

                  Comment


                  • #54
                    Thanks, yes I will add it to the list.

                    E.

                    Comment


                    • #55
                      Wei, can I ask you to confirm? It seems Subjunc does not use any specific splice-site model, is that right? Also, it seems that it considers the paired-end reads separately, that is, the connection is not used, is that correct?
                      Thanks! and congratulations for your article!
                      E.

                      Comment


                      • #56
                        Thanks EduEyras,

                        I'm not sure what you mean 'splice-site model'. Subjunc requires the presence of donor (GT) and receptor(AG) sites when calling exon-exon junctions. It extracts 14 equally spaced 16mers (we can subreads) from each read, maps these subreads to the reference genome using a hashing algorithm and then uses the mapping locations of these subreads to figure out if there is any junction existing in the read and discovers the exact splicing sites in the genome if there is. It does not partition the read sequence into segments like other methods do. It can detect up to four junctions in each read and detect exons as short as 16 bases.

                        Subjunc does not require the use of paired-end reads to detect junctions. It merely uses each individual read to find junctions in the reads and the corresponding splicing sites in the reference genome. However, when paired-end reads are provided, Subjunc will make use of the paired-end distance information to more accurately determine the mapping location of the reads. This is especially useful when reads can be best mapped to more than one location.

                        Hope this answers your questions.

                        Cheers,
                        Wei

                        Comment


                        • #57
                          MISO summuary:

                          MISO in interesting since it can generate both isoform-level and event-level results. It doesn't detect any novelty, but quantifies alternative isoforms/events that are supplied to it in GFF3 format. Quite a few such annotations are provided, including alternative exons, poly-A sites, and full isoforms.
                          MISO is based on genome alignment, and Tophat is recommended. It is pretty fussy to install if you don't have a package manager available, and requires pysam and a few other packages. One quirk is that it does not accept input BAM files with unaligned reads. While Tophat doesn't include unaligned reads and causes no problems, our aligner does, so these files aren't supported. Yarden from the development team is planning to add handling of unaligned reads in the future. Another thing to note is to make sure that the annotation you spply has the same chromosome prefixes as your bam file.
                          Once these technicalities are sorted out, MISO is easy enough to use, and very fast.
                          In the DE step, there's no explicit support for multiple biological samples, so you would have to pool all the samples in one group. From my understanding of the field right now, (http://www.biomedcentral.com/1471-2164/13/484/) multiple biological replicates are considered very important, so this may be a weakness of this program.

                          Comment


                          • #58
                            SplicingCompass summary

                            SplicingCompass would be included together with DEXseq, DiffSplice, and DSGseq, insofar as it's an exon-centric differential expression tool. However, unlike DEXseq and DSGseq, it provides novel junctions as well. Unlike DiffSplice, it does use an annotation. The annotation + novel detection feature of this program is pretty attractive.
                            This is an R package, though as far as i can tell, it's not included in bioconductor. Personally I find it tedious to type lines upon lines of commands into R, and would much prefer to supply a configuration file and run one or a few things on the command line. Alas. Here, at least the instructions are complete, step by step, and on a "for dummies" level. Great.
                            This tool is based on genome alignments. You basically have to run Tophat, because the inputs are both bam files and junction.bed files which Tophat provides. More on this later when I finish testing.

                            Comment


                            • #59
                              Nice summary.

                              When we have replicates we calculate de deltaPSI with MISO for independent comparisons with each replicate, and then between the replicates. We then impose that deltaPSIs are consistent for replicates, and significant compared to the null distribution obtained for the comparison between replicates. Using the Bayes factor also helps to establish a consistent threshold.

                              E.

                              Comment


                              • #60
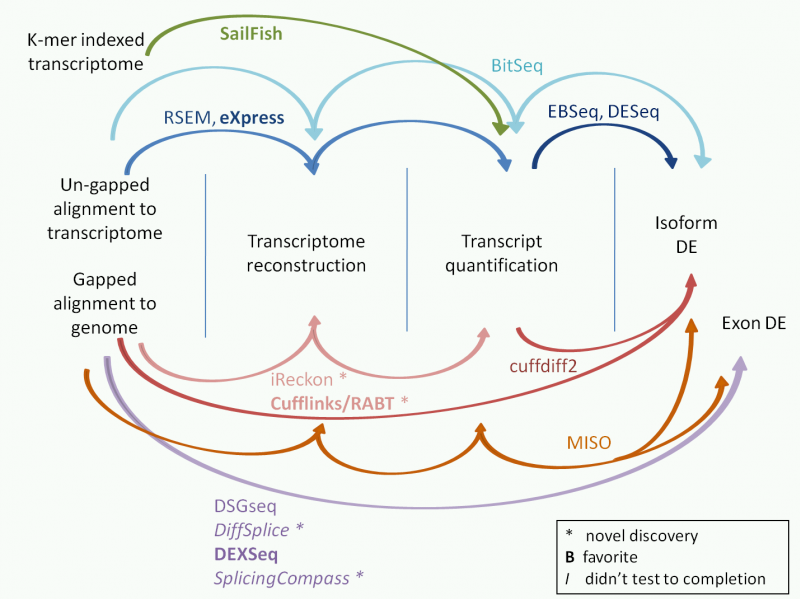
                                As Fabrice requested, I'm putting all the tool summaries, and a newer version of the diagram into one post.

                                Stay tuned to Eduardo's paper, which will be much more thorough.

                                Exon-centric DE

                                DSGseq summary:
                                This programs uses gapped alignments to the genome to generate differential splicing for groups of technical and biological replicates in two treatments. You can't compare just two samples, two samples per group is the minimum.
                                It generates a ranking of differentially spliced genes using their negative binomial statistic which focuses of difference in expression. The NB statistic is provided per gene and per exon. A threshold used in the paper is NB > 5. The program doesn't support reconstruction of isoforms or quantification of specific isoforms, which apparently is computationally harder.
                                I found it easy to get it to run using the example data provided and the instructions. You need to run a preparation step on the gene annotation. Starting from BAM files, you also need to run two preparation steps on each library, first to convert it to BED, and then to get the counts.
                                While the paper clearly says that transcript annotation information is not necessary for the algorithm, you do need to provide a gene annotation file in refFlat format, which the output is based on.
                                The developers are unresponsive so no help is at hand if you get stuck.

                                DEXseq summary
                                This is similar to DSGseq and Diffsplice insofar as the isoform reconstruction and quantification are skipped and differential exon expression is carried out. Whereas the other two tools say that they don't need an annotation for their statistics, this program is based on only annotated exons, and uses the supplied transcript annotation in the form of a GFF file.
                                It also needs at least two replicates per group.
                                I found the usage of this program extremely tedious (as a matlab person). To install it you need to also install numpy and HTSeq. For preparing the data (similarly to DSGseq) you need to do a preparation step on the annotations, and another preparation step for every sample separately which collects the counts (both using python scripts). Then you switch to R, where you need to prepare something called an ExonCountSet object. To do this you need to first make a data.frame R object with the files that come out of the counting step. Yo also need to define a bunch of parameters in the R console. Then you can finally run the analysis. Despite the long instructional PDF, all this is not especially clear, and it's a rather tedious process compared to the others I've tried so far. In the end, I ran makeCompleteDEUAnalysis, and printed out a table of the results. I tried to plot some graphics too, but couldn't because "semi-transparency is not supported on this device". However, there's an extremely useful function that creates a browsable HTML directory with the graphics for all the significant genes. If anyone wants a copy of the workflow I used, send me a message, trying to figure it out might take weeks, but after you get the hang of it, this program is really useful.

                                DiffSplice summary
                                This is a similar approach for exon-centric differential expression to DEXseq and DSGseq (no attempt to reconstruct or quantify specific isoforms). Also supports groups of treatments, minimum 2 samples per group. The SAM inputs and various rather detailed parameters are supplied in two config files. I found this very convenient. In the data config file you can specify treatment group ID, individual IDs, and sample IDs, which determine how the shuffling in their permuation test is done. It was unclear to me what the sample IDs are (as opposed to the individual ID).
                                DiffSplice prefers alignments that come from TopHat or MapSplice because it looks for the XS (strand) tag which BWA doesn't create. There's no need to do a separate preparation step on the alignments. However, if you want you can separate the three steps of the analysis using parameters for selective re-running. This program is user friendly and the doc page makes sense.
                                On the downside, when the program has bad inputs or stops in the middle there's no errors or warnings - it just completes in an unreasonably short time and you get no results.
                                Diffsplice appears to be sensitive to rare deviations from the SAM spec, because while I'm able to successfully run it on mini datasets, the whole datasets are crashing it. I ran Picard's FixMateInformation and ValidateSamFile tools to see if they will make my data acceptable (mates are fine, and sam files are valid! woot), but no dice. It definitely isn't due to the presence of unaligned reads.

                                SplicingCompass summary:
                                SplicingCompass would be included together with DEXseq, DiffSplice, and DSGseq, insofar as it's an exon-centric differential expression tool. However, unlike DEXseq and DSGseq, it provides novel junctions as well. Unlike DiffSplice, it does use an annotation. The annotation + novel detection feature of this program is pretty attractive.
                                This is an R package, though as far as i can tell, it's not included in bioconductor. Personally I find it tedious to type lines upon lines of commands into R, and would much prefer to supply a configuration file and run one or a few things on the command line. Alas. Here, at least the instructions are complete, step by step, and on a "for dummies" level. Great.
                                This tool is based on genome alignments. You basically have to run Tophat, because the inputs are both bam files and junction.bed files which Tophat provides. A downside is that you basically have to use the GTF annotation that they provide which is based on UCSC ccds genes. If you want to use ensembl or something else, you meed to email the developer for an untested procedure that might get you a useable annotation at the end (directly using an ensembl GTF doesn't work).
                                Another problem is that I got no significant exons at the end of the analysis:
                                >sc=initSigGenesFromResults(sc,adjusted=TRUE,threshold=0.1)
                                Error in order(df[, pValName]) : argument 1 is not a vector
                                I'm still unsure as to whether this is due to some mistake or because this tool is extremely conservative.

                                Transcriptome based reconstruction and quantification

                                eXpress summary:
                                This program can take a BAM file in a stream, or a complete SAM or BAM file.
                                It produces a set of isoforms and a quantification of said isoforms. There is no built in differential expression function (yet) so they recommend inputting the rounded effective counts that eXpress produces into EdgeR or DEGSeq. No novel junctions or isoforms are assembled.
                                I used bowtie2 for the alignments to the transcriptome. Once you have those, using eXpress is extremely simple and fun. There's also a cloud version available on Galaxy, though running from the command line is so simple in this case I don't see any advantage to that. Definite favorite!

                                SailFish summary:
                                This program is unique insofar as it isn't based on read alignment to the genome or the transcriptome. It is based on k-mer alignment, which is based on a k-merized reference transcriptome. It is extremely fast. The first, indexing step took about 20 minutes. This step only needs to be run once per reference transcriptome for a certain k-mer size. The second, quant step took from 15 minutes to 1.5 hours depending on the library. The input for the quant step is fastq's as opposed to bam files. No novel junctions or isoforms are assembled.
                                Like eXpress, there is no built in differential expression function. I used the counts from the non-bias-corrected (quant.sf) output file as inputs for DESeq and got reasonable results.
                                The method is published on arXiv, and has been discussed in Lior Pachter's blog. According to the website the manuscript has been submitted for publication. The program is quite user friendly.

                                RSEM +EBSeq summary:
                                This also generates isoforms and quantifies them. It also needs to be followed by an external cont-based DE tool - they recommend EBSeq, which is actually included in the latest RSEM release, and can be run from the command line easily.
                                RSEM can't tolerate any gaps in your transcriptome alignment, including the indels bowtie2 supports. Hence, you either need to align ahead of time with bowtie and input a SAM/BAM, or use the bowtie that's built into the RSEM call and input a fsta/fastq. For me this was unfortunate because we don't keep fastq files on hand (only illumina qseq files) which bowtie doesn't take as inputs. However, it does work! I successfully followed the instructions to execute EBSeq, which is conveniently included as an RSEM function, and gives intelligible results. Together, this workflow is complete.
                                An advantage of RSEM is that it supplies expression relative to the whole transcriptome (RPKM, TPM) and, if supplied with a transcript-to-gene mapping, it also supplies relative expression of transcripts within genes (PSI). ie. transcript A comprises 70% of the expression of gene X, transcript B comprises 20 %, etc. MISO is the only other transcript-based program, as far as I know, that provides this useful information.

                                BitSeq summary:
                                This, like DEXSeq, is an R bioconductor package. I found the manual a lot easier to understand than DEXSeq.
                                They recalculate the probability of each alignment, come up with a set of isoforms, quantify them, and also provide a DE function. In this way, it is the most complete tool I've tried so far, since all the other tools have assumed, skipped, or left out at least one of these stages. Also, BitSeq automatically generates results files, which is useful for people that don't know R. One annoying thing is that (as far as I know) you have to use sam files.
                                For running BitSeq I used the same bowtie2 alignments to the transcriptome as for eXpress. You need to run the function getExpression on each sample separately. Then you make a list of the result objects in each treatment group and run the function getDE on those.

                                Genome based reconstruction and quantification

                                iReckon summary:
                                iReckon generates isoforms and quantifies them. However, this is based on gapped alignment to the genome (unlike eXpress, RSEM and BitSeq which are based on alignments to the transcriptome). It doesn't have a built in DE function, so each sample is run separately.
                                This tool is a little curious because it requires both a gapped alignment to the genome, and the unaligned reads in fastq or fasta format with a reference genome. Since it requires a BWA executable, it's doing some re-alignment. iReckon claims to generate novel isoforms with low false positives by taking into consideration a whole slew of biological and technical biases.
                                One irritating thing in getting the program running is that you need to re-format your refgene annotation file using an esoteric indexing tool from the Savant genome browser package. If you happen to use IGV, this is a bit tedious. Apparently, this will change in the next version. Also, iReckon takes up an enormous amount of memory and scratch space. For a library with 350 million reads, you would need about 800 G scratch space. Apparently everything (run time, RAM, and space) is linear to the number of reads, so this program would be a alright for a subset of the library or for lower coverage libraries.

                                Cufflinks + cuffdiff2 summary:
                                This pipeline, like iReckon, is based on gapped alignment to the genome. It requires the XS tag, so if you're not using tophat to align your RNA, you need to add that tag. I also found out that our gapped aligner introduces some pesky 0M and 0N's in the cigars, since cufflinks doesn't tolerate these. But with these matters sorted out, it's pretty easy to use.
                                I like the versatility. You can run cufflinks for transcriptome reconstruction and isoform quantification in a variety of different modes. For example, with annotations and novel transcript discovery, with annotations and no novel discovery, with no annotations, and with annotations to be ignored in the output. For differential expression, cuffdiff 2 can be run with the results of the transcript quantification from cufflinks to include novel transcripts, or, it can be run directly from the alignment bam files with an annotation. Unlike the exon-based approaches, you don't need to have more than one library in each treatment group, (ie. you can do pairwise comparisons) though if you do it's better to keep them separate than to merge them. The problem here is that the results of cuffdiff are so numerous that it's not easy to figure out what you need in the end. Also, not all the files include the gene/transcript names so you need to do a fair bit of command line munging. There's also cummeRbund, which is a visualization package in R that so far seems to work ok.

                                MISO summary:
                                MISO in interesting since it can generate both isoform-level and event-level results. It doesn't detect any novelty, but quantifies alternative isoforms/events that are supplied to it in GFF3 format. Quite a few such annotations are provided, including alternative exons, poly-A sites, and full isoforms.
                                MISO is based on genome alignment, and Tophat is recommended. It is pretty fussy to install if you don't have a package manager available, and requires pysam and a few other packages. One quirk is that it does not accept input BAM files with unaligned reads. While Tophat doesn't include unaligned reads and causes no problems, our aligner does, so these files aren't supported. Yarden from the development team is planning to add handling of unaligned reads in the future. Another thing to note is to make sure that the annotation you supply has the same chromosome prefixes as your bam file.
                                Once these technicalities are sorted out, MISO is easy enough to use, and very fast for single-end reads. For paired-end reads, my libraries took about 3 days to run on a single host with multi-threading. I couldn't get the cluster submission option to work, which probably speed things up considerably. The main output is the PSI value (the proportion a transcript represents out of the total gene transcription). It also supplies counts, but not FPKM, which makes it harder to compare to other isoform quantification tools that don't provide relative abundance, but concentrate on straight up expression. RSEM is the only other tool to provide PSI as far as I know.
                                In the DE step, there's no explicit support for multiple biological samples (ie. it only supports pairwise comparisons), so you would have to pool all the samples in one group. From my understanding of the field right now, (http://www.biomedcentral.com/1471-2164/13/484/) multiple biological replicates are considered very important, so this may be a weakness of this program.
                                Last edited by Maayanster; 01-29-2014, 05:26 PM.

                                Comment

                                Latest Articles

                                Collapse

                                • seqadmin
                                  Techniques and Challenges in Conservation Genomics
                                  by seqadmin


                                  The field of conservation genomics centers on applying genomics technologies in support of conservation efforts and the preservation of biodiversity. This article features interviews with two researchers who showcase their innovative work and highlight the current state and future of conservation genomics.

                                  Avian Conservation
                                  Matthew DeSaix, a recent doctoral graduate from Kristen Ruegg’s lab at The University of Colorado, shared that most of his research...
                                  03-08-2024, 10:41 AM
                                • seqadmin
                                  The Impact of AI in Genomic Medicine
                                  by seqadmin


                                  Artificial intelligence (AI) has evolved from a futuristic vision to a mainstream technology, highlighted by the introduction of tools like OpenAI's ChatGPT and Google's Gemini. In recent years, AI has become increasingly integrated into the field of genomics. This integration has enabled new scientific discoveries while simultaneously raising important ethical questions1. Interviews with two researchers at the center of this intersection provide insightful perspectives into...
                                  02-26-2024, 02:07 PM

                                ad_right_rmr

                                Collapse

                                News

                                Collapse

                                Topics Statistics Last Post
                                Started by seqadmin, 03-14-2024, 06:13 AM
                                0 responses
                                32 views
                                0 likes
                                Last Post seqadmin  
                                Started by seqadmin, 03-08-2024, 08:03 AM
                                0 responses
                                71 views
                                0 likes
                                Last Post seqadmin  
                                Started by seqadmin, 03-07-2024, 08:13 AM
                                0 responses
                                80 views
                                0 likes
                                Last Post seqadmin  
                                Started by seqadmin, 03-06-2024, 09:51 AM
                                0 responses
                                68 views
                                0 likes
                                Last Post seqadmin  
                                Working...
                                X