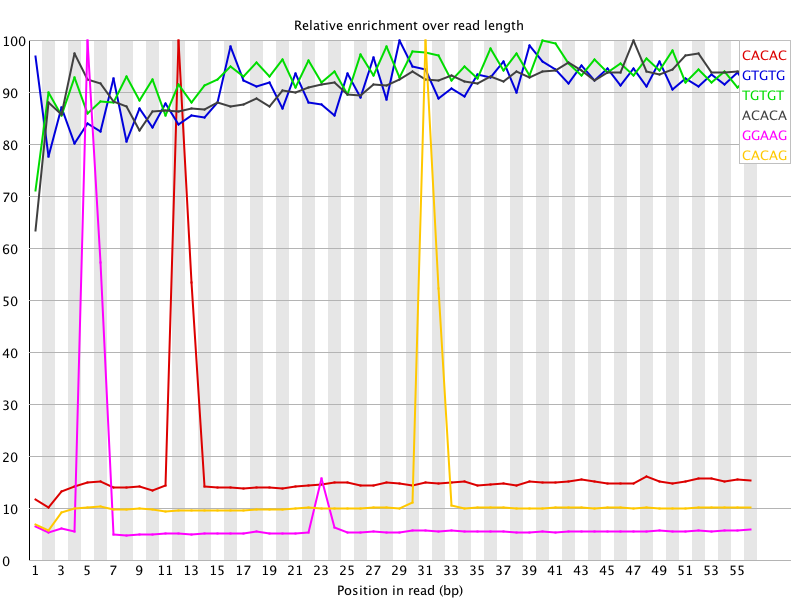
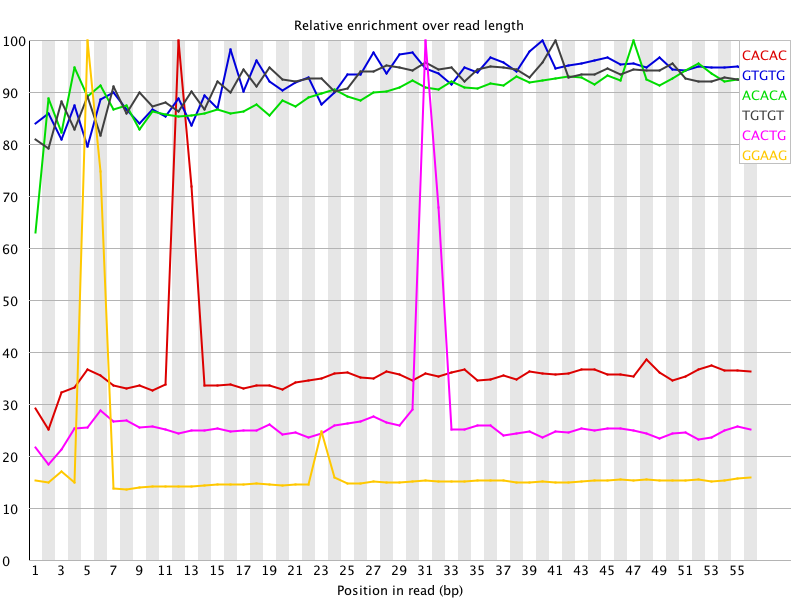
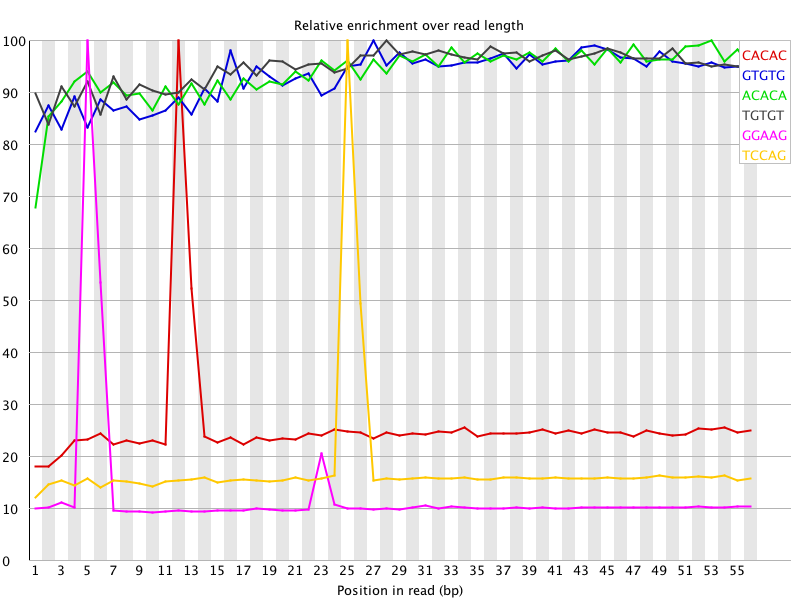
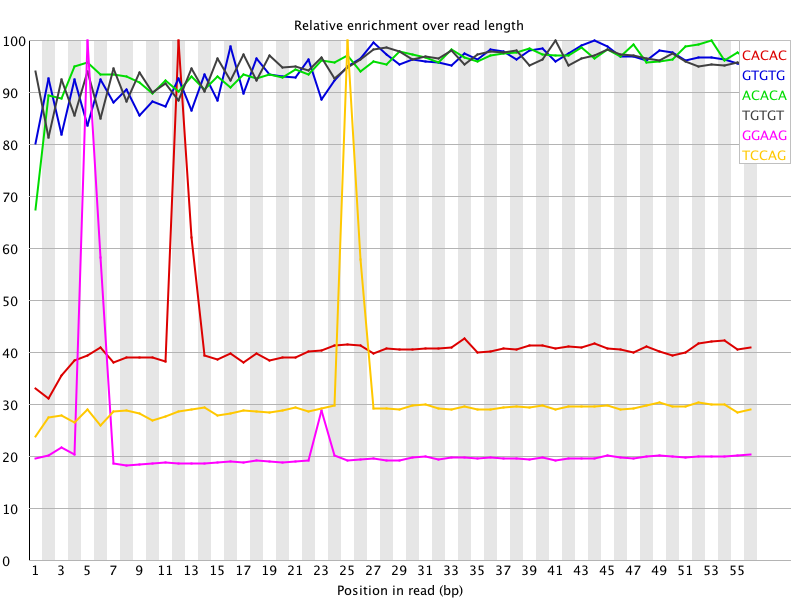
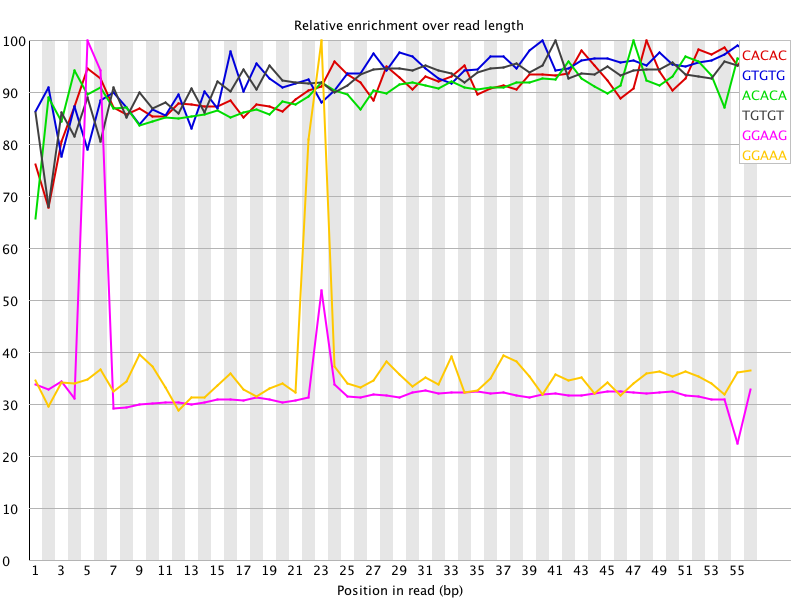
I ran FatsQC on a set of 4 Illumina PE exomes and got really weird graphs for the kmer distribution. I've never seen this pattern before - does anyone know what is going on and what to do about it?


You are currently viewing the SEQanswers forums as a guest, which limits your access. Click here to register now, and join the discussion


| Topics | Statistics | Last Post | ||
|---|---|---|---|---|
|
Started by SEQadmin2, 07-31-2026, 02:55 AM
|
0 responses
18 views
0 reactions
|
Last Post
by SEQadmin2
07-31-2026, 02:55 AM
|
||
|
Started by SEQadmin2, 07-24-2026, 12:17 PM
|
0 responses
15 views
0 reactions
|
Last Post
by SEQadmin2
07-24-2026, 12:17 PM
|
||
|
Started by SEQadmin2, 07-23-2026, 11:41 AM
|
0 responses
14 views
0 reactions
|
Last Post
by SEQadmin2
07-23-2026, 11:41 AM
|
||
|
Started by SEQadmin2, 07-20-2026, 11:10 AM
|
0 responses
25 views
0 reactions
|
Last Post
by SEQadmin2
07-20-2026, 11:10 AM
|
Comment