Unconfigured Ad

Collapse
X
 
  • Filter
  • Time
  • Show
Clear All
new posts
  • Brian Bushnell
    Super Moderator
    • Jan 2014
    • 2709

    Sawtooth base frequency, wavy insert size histograms.

    I am analyzing some NextSeq data and see odd patterns in the insert size and base composition histograms, that I can't explain. The library is of a bacteria (M.ruber) and fragmented with sonication to a target 270bp insert size. The run was 2x151bp.

    The base composition graph concatenates read 1 and read 2, so position 0-150 are read 1 and 151-302 are read 2. Each read has a sawtooth pattern for all bases, with a period of exactly 3bp.
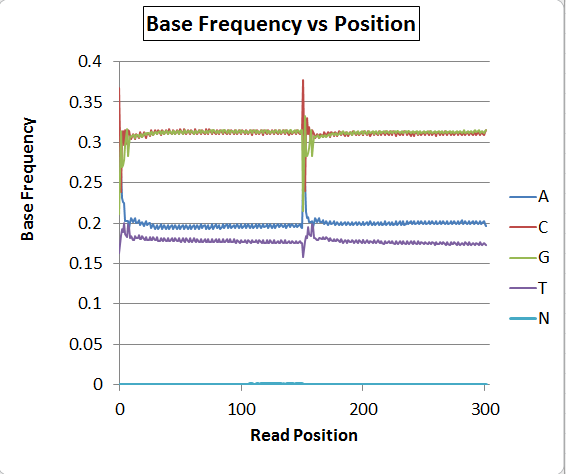


    There's obviously a major problem with base-calling as the A/T ratio is quite skewed, but putting that aside for now, has anyone seen the sawtooth pattern before? I saw it once on some MiSeq Nextera data also, and could not explain it then, either. A second run on the NextSeq (on a fungus) does NOT have the sawtooth pattern, but still has the distorted A/T ratio. Bacteria are mostly coding and the fungus is mostly noncoding, so I'm speculating that it could be a real artifact related to codon frequencies and nonrandom fragmentation sites rather than a software bug, but I'm not sure.

    Next, the insert size distribution also has a regular patter, this one with a 10bp period.
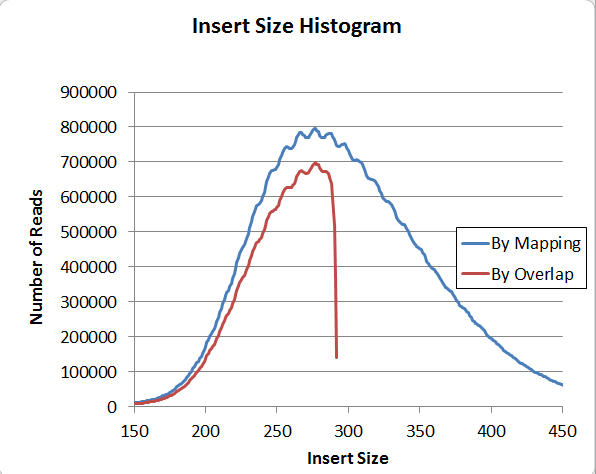


    This pattern exists when the insert size is calculated using two independent methods, by mapping and by overlap (overlap is of course restricted to under 300bp). So I am confident that it's actually in the data and not a software problem; and furthermore, it's present in genomic reads, or else it would not show up on the mapping histogram. Has anyone seen that before?
    Attached Files
  • nucacidhunter
    Jafar Jabbari
    • Jan 2013
    • 1250

    #2
    I wonder what is read duplication rate and the number of reads.

    Comment

    • Brian Bushnell
      Super Moderator
      • Jan 2014
      • 2709

      #3
      The duplication rate appears very low (considering it's only a ~3Mbp organism). Here's a plot of read uniqueness for the first 10m read pairs (out of 124m total pairs):


      The way to interpret this... each read is examined for its first 31-mer and a random 31-mer. These are added to a hashtable. If they were already present, the read is considered non-unique; otherwise, it is considered unique. Errors will inflate the apparent uniqueness. The cumulative ratio of unique vs non-unique reads is reported every 25k reads. The more nonuniform the library, the faster the value drops. There are multiple lines because I track "first" and "random" separately, and I also track read 1 and read 2 both separately and combined.

      The wavyness here is probably due to some problem with the optics, correlating with individual image frames.
      Attached Files

      Comment

      • nucacidhunter
        Jafar Jabbari
        • Jan 2013
        • 1250

        #4
        I would suggest first to check for sequencer faults which person running the machine should be able to do it. If that is ruled out as a possible cause, I would look next to the library prep and its diversity. The wavyness in base frequency looks similar to what I have seen with low diversity mate pair libraries where a library with below 10M unique fragments have been sequenced in 100sM (though the frequency was larger than 3) and also low diversity amplicon libraries. Out of curiosity, how the duplication rate could be low. In a 3 Mb genome there is only possibility of obtaining 3M unique fragments (at least in this case in initial 100 bp). If this library is sequenced to a depth of 124M reads there would be high level of duplication.

        Comment

        • Brian Bushnell
          Super Moderator
          • Jan 2014
          • 2709

          #5
          Originally posted by nucacidhunter View Post
          Out of curiosity, how the duplication rate could be low. In a 3 Mb genome there is only possibility of obtaining 3M unique fragments (at least in this case in initial 100 bp). If this library is sequenced to a depth of 124M reads there would be high level of duplication.
          So, this is a 2x151bp library; as expected, after 10M read pairs, the number of read1 with a unique first 31-mer drops to around 35%. This is consistent with a high uniqueness - if every starting location on the genome was used, you could only get up to around 31% uniqueness (it's actually about 3.09 Mbp). The fact that some reads have errors pushes it higher to 35% but it's still good.

          But there's also pair uniqueness, for which I use a hash of the middle 31-mer in read 1 and read 2. This represents the fraction of read pairs with a unique start+stop combination, and thus is a much better measure of library duplication rate. By that metric, of the first 10 million read pairs, 99% of them are unique, which indicates the library has a very low duplication rate. Though certainly if I extended the graph all the way to 124 million pairs I would expect that to drop a bit.

          Comment

          Latest Articles

          Collapse

          • mylaser
            Reply to Advanced Sequencing Platforms Tackle Neuroscience’s Toughest Genomics Problems
            by mylaser
            Kheloyar – Everything You Need to Know About Kheloyaar Login and Kheoyar Id
            If you are looking for an online gaming platform that offers a user-friendly experience, Kheloyar has become a name that many users search for. Whether you're interested in creating a new account, accessing your dashboard through Kheloyaar Login, or learning how to obtain a Kheoyar Id, understanding the platform's features and account process is essential.
            This guide explains everything you need to know about...
            Today, 01:13 AM
          • SEQadmin2
            Advanced Sequencing Platforms Tackle Neuroscience’s Toughest Genomics Problems
            by SEQadmin2


            Genomics studies in neuroscience face a special challenge due to the brain’s complexity and scarcity of samples. Mapping changes in cell type and state using conventional next-generation sequencing methods remains challenging. Advances in technologies like single-cell sequencing, spatial transcriptomics, and long-read sequencing have opened the door to deeper studies of the brain and diseases like Alzheimer’s, amyotrophic lateral sclerosis (ALS), and schizophrenia.
            ...
            07-09-2026, 11:10 AM
          • SEQadmin2
            Cancer Drug Resistance: The Lingering Barrier to Rising Survival
            by SEQadmin2


            Cancer survival rates have significantly increased in the last few decades in the United States, reaching a combined 70% 5-year survival rate by 2021. Behind this number, there are years of research to find new therapies, drug targets, and early detection methods. But there is one core challenge that keeps slowing down these advances, and it’s about drug resistance.

            There is no single reason why many patients don’t respond to treatment as expected. Cancer is...
            07-08-2026, 05:17 AM

          ad_right_rmr

          Collapse

          News

          Collapse

          Topics Statistics Last Post
          Started by SEQadmin2, 07-09-2026, 10:04 AM
          0 responses
          15 views
          0 reactions
          Last Post SEQadmin2  
          Started by SEQadmin2, 07-08-2026, 10:08 AM
          0 responses
          10 views
          0 reactions
          Last Post SEQadmin2  
          Started by SEQadmin2, 07-07-2026, 11:05 AM
          0 responses
          22 views
          0 reactions
          Last Post SEQadmin2  
          Started by SEQadmin2, 07-02-2026, 11:08 AM
          0 responses
          31 views
          0 reactions
          Last Post SEQadmin2  
          Working...