Unconfigured Ad

Collapse
X
 
  • Filter
  • Time
  • Show
Clear All
new posts
  • bioinfosm
    Senior Member
    • Jan 2008
    • 483

    1st cycle report

    Hi,

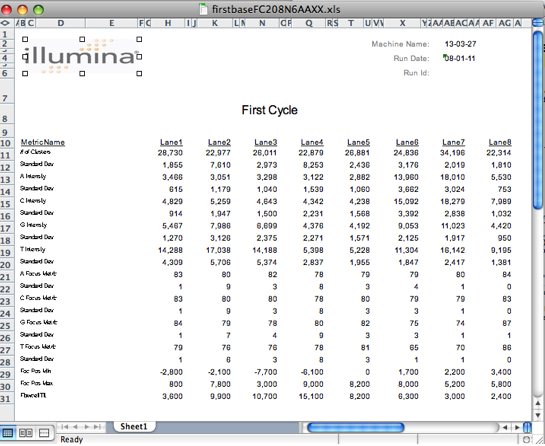
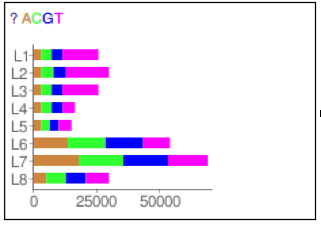
    The Solexa first cycle report gives numbers as the cluster count per lane, Intensity and Std dev of A C G Ts, some focus metrics and tilt.

    Anything that can be mined out of all these statistics? We are yet to use this report to actually summarize it in words and be able to say something about the quality of run, etc.

    Observations?
    --
    bioinfosm
  • cariaso
    Member
    • Jan 2008
    • 31

    #2
    I've worked with the first cycle incorporation reports (.xls) a bit. WikiLIMS uses google charts to turn this


    into this


    It serves as a visual summary of the A,T,C,G intensities on a per-lane basis. Perhaps that is useful, or will inspire thoughts on what more you'd like distilled.

    <blatant ad>I'll be presenting this and much more during Sept 21 in Providence </blatant ad>
    Last edited by cariaso; 09-03-2008, 01:13 PM.

    Comment

    • bioinfosm
      Senior Member
      • Jan 2008
      • 483

      #3
      Thanks ... anyone else has comments?

      I wont be able to make it to RI ... any chance you could post the slides to me?

      ~sm
      --
      bioinfosm

      Comment

      • cariaso
        Member
        • Jan 2008
        • 31

        #4
        After they've been delivered I'll update this thread with a google docs url.

        Comment

        • bioinfosm
          Senior Member
          • Jan 2008
          • 483

          #5
          Originally posted by cariaso View Post
          After they've been delivered I'll update this thread with a google docs url.
          Awesome.. Thanks!
          --
          bioinfosm

          Comment

          • bioinfosm
            Senior Member
            • Jan 2008
            • 483

            #6
            IVC.htm plots

            Is there a good way to look at the Intensity vs Cycle number plots and say about the tile?

            There is an attached image here as an example..
            Attached Files
            --
            bioinfosm

            Comment

            • cariaso
              Member
              • Jan 2008
              • 31

              #7
              Well it seems my fondness for screen shots made this too big for google docs. Truth be told much of the demo was actually live against real systems, instead of being based on the slides. Lastly I didn't provide much text or speaker notes. So I don't know how much value anyone will get from these, but as promised here they are at

              Comment

              • bioinfosm
                Senior Member
                • Jan 2008
                • 483

                #8
                Thanks !

                However, its just that image you have in the slides, any info on the interpretation? how useful is the 1st cycle report info?
                --
                bioinfosm

                Comment

                • cariaso
                  Member
                  • Jan 2008
                  • 31

                  #9
                  Its an excellent snapshot for some purposes, lousy for others. At Rhode Island George Grills of Cornell showed some images of QC lane analysis which I believe were generated by intel and I'm now inquiring about over on
                  New here? Stop in and introduce yourself. Where you are, what you work on, etc.

                  as for usefulness and interpretation. For the McCombie lab this was the first thing they wanted to know about their data. They had an excel sheet full of numbers, but no intuition on what it meant. This viz addesses that. However it isn't meant for drilldown and deeper analysis, at least until someone tells me what they'd like to know next.

                  Comment

                  • bioinfosm
                    Senior Member
                    • Jan 2008
                    • 483

                    #10
                    Thanks !
                    Do update in case you get hold of the images, or more interpretation..
                    --
                    bioinfosm

                    Comment

                    • cariaso
                      Member
                      • Jan 2008
                      • 31

                      #11
                      wikilims cshl poster

                      Since my slides were nearly devoid of text, perhaps this poster will be useful.

                      Comment

                      • bioinfosm
                        Senior Member
                        • Jan 2008
                        • 483

                        #12
                        Thanks, but the link did not work for me..
                        --
                        bioinfosm

                        Comment

                        Latest Articles

                        Collapse

                        ad_right_rmr

                        Collapse

                        News

                        Collapse

                        Topics Statistics Last Post
                        Started by SEQadmin2, 06-09-2026, 11:58 AM
                        0 responses
                        25 views
                        0 reactions
                        Last Post SEQadmin2  
                        Started by SEQadmin2, 06-05-2026, 10:09 AM
                        0 responses
                        32 views
                        0 reactions
                        Last Post SEQadmin2  
                        Started by SEQadmin2, 06-04-2026, 08:59 AM
                        0 responses
                        39 views
                        0 reactions
                        Last Post SEQadmin2  
                        Started by SEQadmin2, 06-02-2026, 12:03 PM
                        0 responses
                        62 views
                        0 reactions
                        Last Post SEQadmin2  
                        Working...