Unconfigured Ad

Collapse
X
 
  • Filter
  • Time
  • Show
Clear All
new posts
  • xile
    Member
    • Sep 2008
    • 15

    The DGE result can't confirm the micorarray data

    Hi,

    It is my first time to use the house-make reagents to prepare DGE-tag profiling library for sequencing. The sequencing result seem to not perfectly comfirm the microarray result and they are from the same samples (seeClick image for larger version

Name:	sample1.JPG
Views:	1
Size:	62.7 KB
ID:	307415
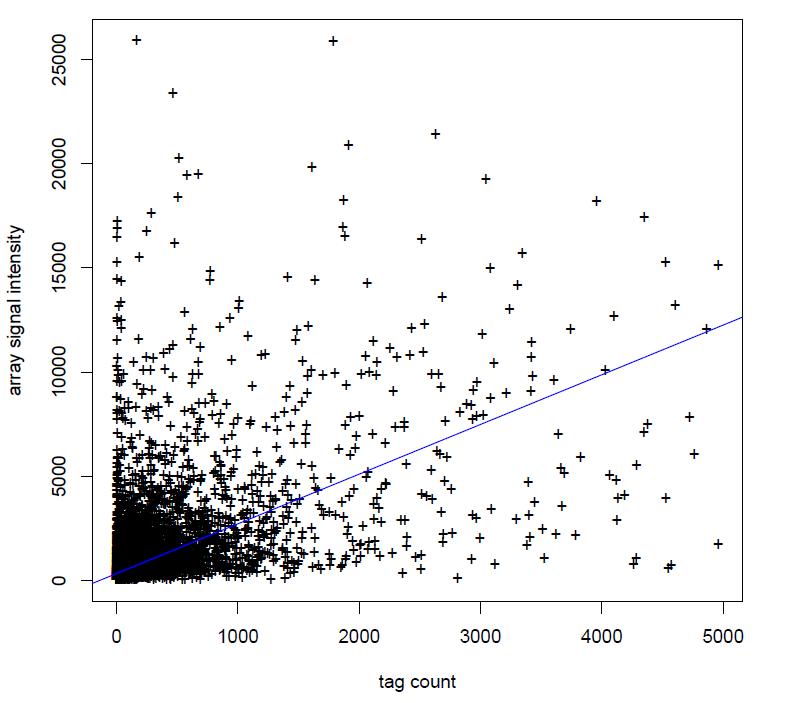
). The eighty percent reads can map to the arabidopsis cDNA sequences, but only about fifty percent reads can map to tag table from the nearest restriction site to 3' teminal of cDNA. The tag table made by myself. Is it normal? Could you give me some advice on sample preparation?

    Maybe the insufficiency of enzyme digestion result in the low proportion of reads mapping to tag table. But I don't think it's the main reason of the low consistency with microarray data.

    Thanks.
  • steven
    Senior Member
    • Aug 2009
    • 269

    #2
    Could you please precise how the "tag count" values were obtained? It seems that you are working with SAGE tags, is that correct?
    Is there a published study where SAGE-based DGE is compared with microarray data (and with a good correlation)? It could help to identify what could differ from your experiment.

    Comment

    • xile
      Member
      • Sep 2008
      • 15

      #3
      Originally posted by steven View Post
      Could you please precise how the "tag count" values were obtained? It seems that you are working with SAGE tags, is that correct?
      Is there a published study where SAGE-based DGE is compared with microarray data (and with a good correlation)? It could help to identify what could differ from your experiment.
      Thanks.
      We followed the protocol of "Preparing Samples for Digital Gene Expression-Tag Profiling with NlaIII" from illumina to generates a unique 16 bp for each transcript, anchored with the recognition site by the restriction enzyme NlaIII. The 16 bp sequencing data combined with the known NlaIII restriction site ("CATG") data generates the unique 20 bp tag used for annotation. The quantitative expression level of the unique transcripts is demonstrated by the number of times the sequence is detected. The tags come from the nearest restriction site to 3' teminal of arabidopsis cDNA.

      There is an official introduction in the attachmentrnaDGETagProfiling.pdf.

      Comment

      • steven
        Senior Member
        • Aug 2009
        • 269

        #4
        Thanks for the info!
        Indeed, a partial digestion can explain a part of the tags that do not match to your index. Considering the penultimate restriction site of the transcripts for the index could help to get some tags back. Also, as the annotation of the ends of plant genes is less reliable than for instance in human (lack of polyA site consensus), considering potentially longer transcripts by virtually extending a bit the 3'UTRs could also help (like done here).

        However, I am afraid I can not help regarding the lack of correlation array/DGE..
        Do you by chance have technical or biological replicates of one of these experiments?
        Does the protocol only retain polyA+ long RNAs? No possible contamination by sRNAs?
        Maybe something wrong with the index table (genome/annotation version..)? Did you double check the position of a few tags "manually"?
        good luck..

        Comment

        • BENM
          Member
          • May 2009
          • 33

          #5
          May be you can find the answer at this papers "H. Alexander Ebhardt etc. al., Meta-analysis of small RNA-sequencing errors reveals ubiquitous post-transcriptional RNA modifications, Nucleic Acids Research, 2009, 1–10, doi:10.1093/nar/gkp093", I am not a biologiest, so I don't know what the key point is in this matter.

          Comment

          • xile
            Member
            • Sep 2008
            • 15

            #6
            Originally posted by steven View Post
            Thanks for the info!
            Indeed, a partial digestion can explain a part of the tags that do not match to your index. Considering the penultimate restriction site of the transcripts for the index could help to get some tags back. Also, as the annotation of the ends of plant genes is less reliable than for instance in human (lack of polyA site consensus), considering potentially longer transcripts by virtually extending a bit the 3'UTRs could also help (like done here).

            However, I am afraid I can not help regarding the lack of correlation array/DGE..
            Do you by chance have technical or biological replicates of one of these experiments?
            Does the protocol only retain polyA+ long RNAs? No possible contamination by sRNAs?
            Maybe something wrong with the index table (genome/annotation version..)? Did you double check the position of a few tags "manually"?
            good luck..
            Thanks for your advice.
            Another sample from different treatment on the same flewcell seem to be bad as this.
            The protocol only retains polyA+ long RNAs.
            Last edited by xile; 09-15-2009, 05:34 AM.

            Comment

            • xile
              Member
              • Sep 2008
              • 15

              #7
              Originally posted by BENM View Post
              May be you can find the answer at this papers "H. Alexander Ebhardt etc. al., Meta-analysis of small RNA-sequencing errors reveals ubiquitous post-transcriptional RNA modifications, Nucleic Acids Research, 2009, 1–10, doi:10.1093/nar/gkp093", I am not a biologiest, so I don't know what the key point is in this matter.
              Thanks. I think the proportion of RNA modifications is lower.

              Comment

              • bioinfosm
                Senior Member
                • Jan 2008
                • 483

                #8
                Also, when you annotate a tag to a transcript, do you make sure that it is the 3' most tag? We saw that though 3' most is the major tag, partial digestion causes other tags to be present as well, which need to be all summed up to get the final tag-count for the gene.
                --
                bioinfosm

                Comment

                • xile
                  Member
                  • Sep 2008
                  • 15

                  #9
                  Originally posted by bioinfosm View Post
                  Also, when you annotate a tag to a transcript, do you make sure that it is the 3' most tag? We saw that though 3' most is the major tag, partial digestion causes other tags to be present as well, which need to be all summed up to get the final tag-count for the gene.
                  I saw that about 20 % of total reads is not the 3' most tag.

                  Comment

                  • jwaage
                    Member
                    • Sep 2008
                    • 16

                    #10
                    Try to log2/log10 transform reads and intensity, and do plotting / linear modelling then...

                    Comment

                    • bioinfosm
                      Senior Member
                      • Jan 2008
                      • 483

                      #11
                      Originally posted by xile View Post
                      I saw that about 20 % of total reads is not the 3' most tag.
                      Does including/excluding them make a difference to the correlation plot?
                      --
                      bioinfosm

                      Comment

                      • xile
                        Member
                        • Sep 2008
                        • 15

                        #12
                        Originally posted by jwaage View Post
                        Try to log2/log10 transform reads and intensity, and do plotting / linear modelling then...
                        Thanks. I redraw the plotClick image for larger version

Name:	log.JPG
Views:	1
Size:	71.0 KB
ID:	303143.and it's looks better. Is it normal? I have no experience for this DGE-tag data.
                        Last edited by xile; 09-16-2009, 06:49 PM.

                        Comment

                        • xile
                          Member
                          • Sep 2008
                          • 15

                          #13
                          Originally posted by bioinfosm View Post
                          Does including/excluding them make a difference to the correlation plot?
                          Thanks, It's not significant different.

                          Comment

                          • jwaage
                            Member
                            • Sep 2008
                            • 16

                            #14
                            Your graph looks decent. What's your correlation coefficient (R2) - our experience (and other litterature) typically shows between 55 and 70 depending on tissue and experimental setup.

                            Comment

                            • xile
                              Member
                              • Sep 2008
                              • 15

                              #15
                              Originally posted by jwaage View Post
                              Your graph looks decent. What's your correlation coefficient (R2) - our experience (and other litterature) typically shows between 55 and 70 depending on tissue and experimental setup.
                              After log2 transforming, the correlation coefficient is 0.6637376.

                              Comment

                              Latest Articles

                              Collapse

                              ad_right_rmr

                              Collapse

                              News

                              Collapse

                              Topics Statistics Last Post
                              Started by SEQadmin2, 06-05-2026, 10:09 AM
                              0 responses
                              13 views
                              0 reactions
                              Last Post SEQadmin2  
                              Started by SEQadmin2, 06-04-2026, 08:59 AM
                              0 responses
                              24 views
                              0 reactions
                              Last Post SEQadmin2  
                              Started by SEQadmin2, 06-02-2026, 12:03 PM
                              0 responses
                              28 views
                              0 reactions
                              Last Post SEQadmin2  
                              Started by SEQadmin2, 06-02-2026, 11:40 AM
                              0 responses
                              22 views
                              0 reactions
                              Last Post SEQadmin2  
                              Working...