 Tweet
Tweet
I am analyzing some NextSeq data and see odd patterns in the insert size and base composition histograms, that I can't explain. The library is of a bacteria (M.ruber) and fragmented with sonication to a target 270bp insert size. The run was 2x151bp.
The base composition graph concatenates read 1 and read 2, so position 0-150 are read 1 and 151-302 are read 2. Each read has a sawtooth pattern for all bases, with a period of exactly 3bp.
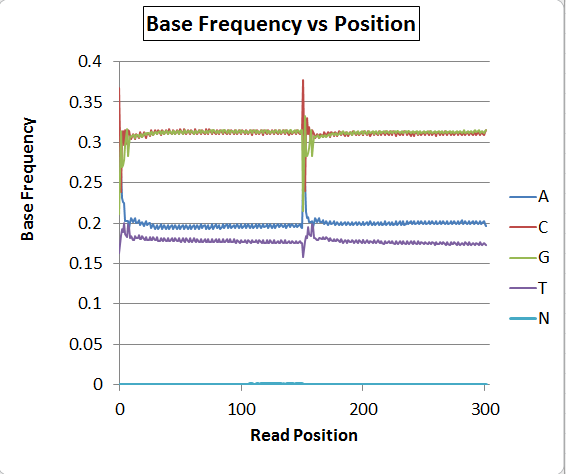
There's obviously a major problem with base-calling as the A/T ratio is quite skewed, but putting that aside for now, has anyone seen the sawtooth pattern before? I saw it once on some MiSeq Nextera data also, and could not explain it then, either. A second run on the NextSeq (on a fungus) does NOT have the sawtooth pattern, but still has the distorted A/T ratio. Bacteria are mostly coding and the fungus is mostly noncoding, so I'm speculating that it could be a real artifact related to codon frequencies and nonrandom fragmentation sites rather than a software bug, but I'm not sure.
Next, the insert size distribution also has a regular patter, this one with a 10bp period.
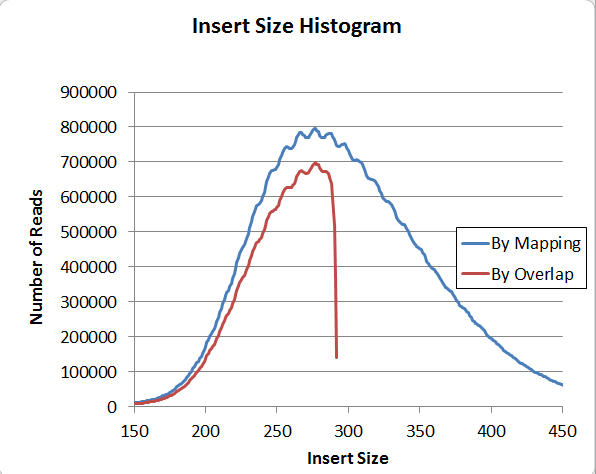
This pattern exists when the insert size is calculated using two independent methods, by mapping and by overlap (overlap is of course restricted to under 300bp). So I am confident that it's actually in the data and not a software problem; and furthermore, it's present in genomic reads, or else it would not show up on the mapping histogram. Has anyone seen that before?
The base composition graph concatenates read 1 and read 2, so position 0-150 are read 1 and 151-302 are read 2. Each read has a sawtooth pattern for all bases, with a period of exactly 3bp.
There's obviously a major problem with base-calling as the A/T ratio is quite skewed, but putting that aside for now, has anyone seen the sawtooth pattern before? I saw it once on some MiSeq Nextera data also, and could not explain it then, either. A second run on the NextSeq (on a fungus) does NOT have the sawtooth pattern, but still has the distorted A/T ratio. Bacteria are mostly coding and the fungus is mostly noncoding, so I'm speculating that it could be a real artifact related to codon frequencies and nonrandom fragmentation sites rather than a software bug, but I'm not sure.
Next, the insert size distribution also has a regular patter, this one with a 10bp period.
This pattern exists when the insert size is calculated using two independent methods, by mapping and by overlap (overlap is of course restricted to under 300bp). So I am confident that it's actually in the data and not a software problem; and furthermore, it's present in genomic reads, or else it would not show up on the mapping histogram. Has anyone seen that before?
Comment