 Tweet
Tweet
I've try to reproduce the graphic view (genome-wide coverage) of the ENCODE-CSHL long RNA-seq http://hgdownload.cse.ucsc.edu/golde...shlLongRnaSeq/
Let's say, K562-Chromatin-Rep4 as an example. http://hgdownload.cse.ucsc.edu/golde...talAlnRep4.bam
Luckily, it provides the bigwig file as well.Thus I've an idea to test whether I can reproduce the same data visualization.
http://hgdownload.cse.ucsc.edu/golde...SigRep4.bigWig
1. bigWig provided by paper
I upload the Plus strand bigwig into UCSC, with the very default options:
2. genomeCoverage generate bigWig
genomeCoverage tool is one of the BEDtools toolbox.
Then using bedGraphToBigwig (UCSC exe) to convert bedgraph into bigwig:
Finally upload them into Galaxy and then send to UCSC genome browser.

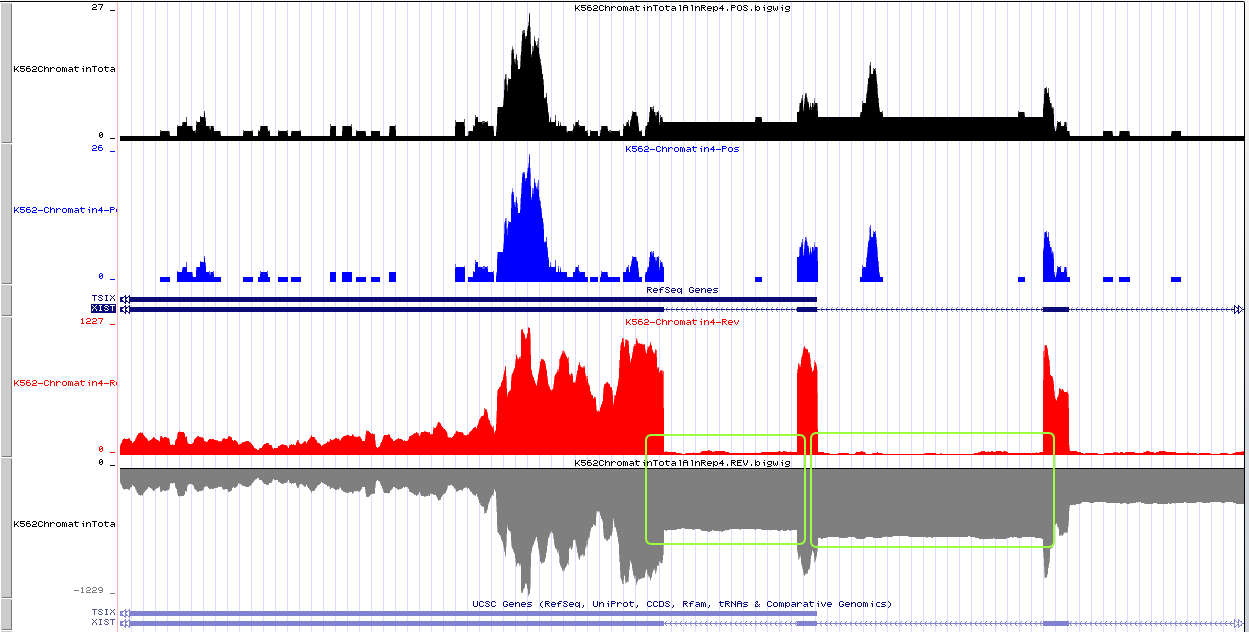
Thus, in the image, from top to bottom:
Black: Forward_strand_my_version
Blue: Forward_strand_ENCODE_default
Red: Reverse_strand_my_version
Grey: Reverse_strand_ENCODE_version
The result is strange: General expression wave is similar, they share same peak. But my-version-bigwig give higher basal level (notice the y-axis).
And please note the gene I give an example here, Xist. It seems that if I my self calculate the coverage, the Xist intron is NOT spliced off the primary mRNA (indicated by green box).
Any suggestions?
Let's say, K562-Chromatin-Rep4 as an example. http://hgdownload.cse.ucsc.edu/golde...talAlnRep4.bam
Luckily, it provides the bigwig file as well.Thus I've an idea to test whether I can reproduce the same data visualization.
http://hgdownload.cse.ucsc.edu/golde...SigRep4.bigWig
1. bigWig provided by paper
I upload the Plus strand bigwig into UCSC, with the very default options:
Code:
track name='K562-Chromatin4-Pos' type="bigWig" color=0,0,255 bigDataUrl=http://hgdownload.cse.ucsc.edu/goldenPath/hg19/encodeDCC/wgEncodeCshlLongRnaSeq/wgEncodeCshlLongRnaSeqK562ChromatinTotalPlusRawSigRep4.bigWig
genomeCoverage tool is one of the BEDtools toolbox.
Code:
samtools sort wgEncodeCshlLongRnaSeqK562ChromatinTotalAlnRep4.bam wgEncodeCshlLongRnaSeqK562ChromatinTotalAlnRep4.bam.sort
Code:
genomeCoverage -bg -ibam wgEncodeCshlLongRnaSeqK562ChromatinTotalAlnRep4.bam.sort -g hg19.chromInfo -strand + >K562chromatin.POS.bedgraph
Code:
genomeCoverageBed -bg -ibam wgEncodeCshlLongRnaSeqK562ChromatinTotalAlnRep4.bam.sorted.bam -g ../hg19.chromInfo -strand -|awk '{$4 = - $4;print $0}' >K562ChromatinTotalAlnRep4.REV.bedgraph
Code:
bedGraphToBigwig K562chromatin.POS.bedgraph hg19.chromInfo K562chromatin.POS.bigwig
Thus, in the image, from top to bottom:
Black: Forward_strand_my_version
Blue: Forward_strand_ENCODE_default
Red: Reverse_strand_my_version
Grey: Reverse_strand_ENCODE_version
The result is strange: General expression wave is similar, they share same peak. But my-version-bigwig give higher basal level (notice the y-axis).
And please note the gene I give an example here, Xist. It seems that if I my self calculate the coverage, the Xist intron is NOT spliced off the primary mRNA (indicated by green box).
Any suggestions?
Comment