Seqanswers Leaderboard Ad

Collapse

Announcement

Collapse
No announcement yet.
X
 
  • Filter
  • Time
  • Show
Clear All
new posts

  • FastQC interpretation

    Hello,

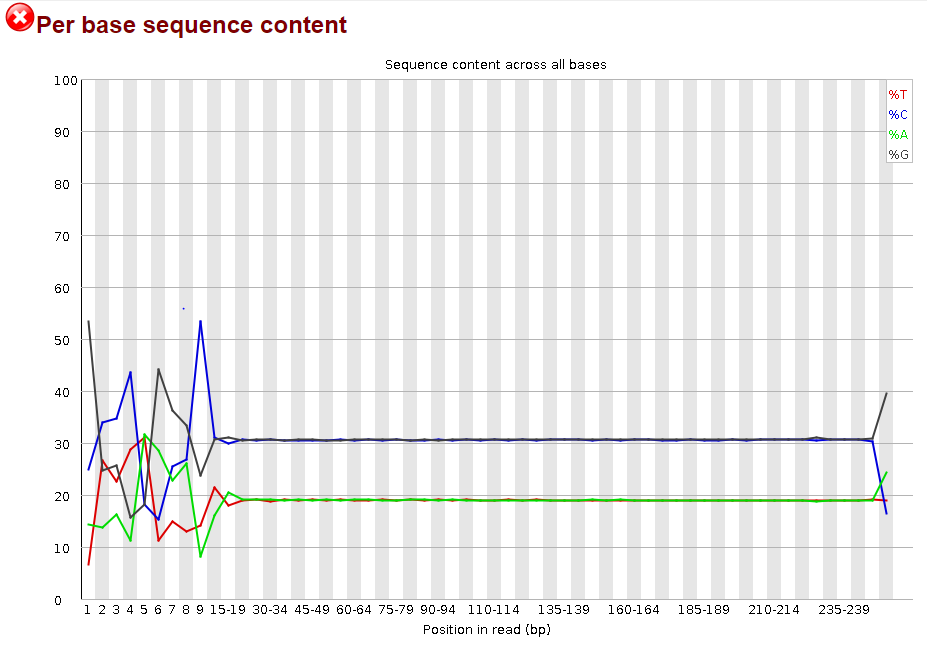
    I would love some advice on my linked image below. I was using FastQC to look at the data from a recent MiSeq run. All my isolates are flagged at the "Per base sequence content". I am to understand that a 'good' graph is expected to look like all the bases are of similar % throughout. The DNA sequenced is from Pseudomonas aeruginosa, and I am seeing a high GC content (as expected) and much lower AT content.

    Any advice or explanation would be greatly helpful!

    Click image for larger version

Name:	Capture.PNG
Views:	1
Size:	83.8 KB
ID:	309592

  • #2
    This type of pattern is observed in a couple of cases. One is random priming used in RNAseq libraries and other is where you are making libraries that include transposases. The bias at the beginning of the reads is likely due to the Nextera transposase sequence bias (similar to bias seen in "random priming") .
    Last edited by GenoMax; 04-25-2019, 07:47 AM.

    Comment

    Latest Articles

    Collapse

    • seqadmin
      Essential Discoveries and Tools in Epitranscriptomics
      by seqadmin


      The field of epigenetics has traditionally concentrated more on DNA and how changes like methylation and phosphorylation of histones impact gene expression and regulation. However, our increased understanding of RNA modifications and their importance in cellular processes has led to a rise in epitranscriptomics research. “Epitranscriptomics brings together the concepts of epigenetics and gene expression,” explained Adrien Leger, PhD, Principal Research Scientist on Modified Bases...
      Yesterday, 07:01 AM
    • seqadmin
      Current Approaches to Protein Sequencing
      by seqadmin


      Proteins are often described as the workhorses of the cell, and identifying their sequences is key to understanding their role in biological processes and disease. Currently, the most common technique used to determine protein sequences is mass spectrometry. While still a valuable tool, mass spectrometry faces several limitations and requires a highly experienced scientist familiar with the equipment to operate it. Additionally, other proteomic methods, like affinity assays, are constrained...
      04-04-2024, 04:25 PM

    ad_right_rmr

    Collapse

    News

    Collapse

    Topics Statistics Last Post
    Started by seqadmin, 04-11-2024, 12:08 PM
    0 responses
    39 views
    0 likes
    Last Post seqadmin  
    Started by seqadmin, 04-10-2024, 10:19 PM
    0 responses
    41 views
    0 likes
    Last Post seqadmin  
    Started by seqadmin, 04-10-2024, 09:21 AM
    0 responses
    35 views
    0 likes
    Last Post seqadmin  
    Started by seqadmin, 04-04-2024, 09:00 AM
    0 responses
    55 views
    0 likes
    Last Post seqadmin  
    Working...
    X