Seqanswers Leaderboard Ad

Collapse

Announcement

Collapse
No announcement yet.
X
 
  • Filter
  • Time
  • Show
Clear All
new posts

  • Ion Torrent fastqc results

    Previously I've used Illumina for my sequencing needs and recently I've been handed some Ion Torrent data to do RNA-Seq.

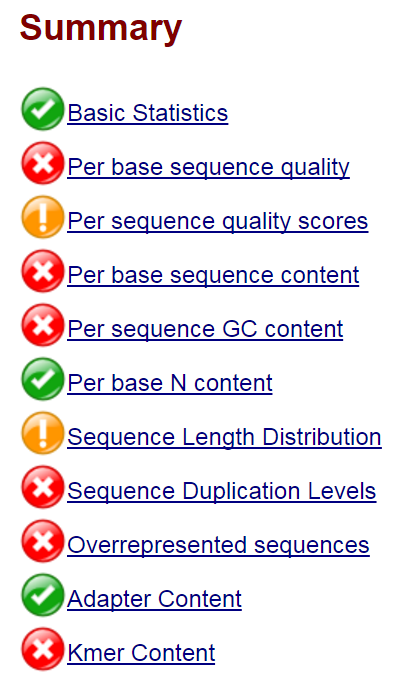
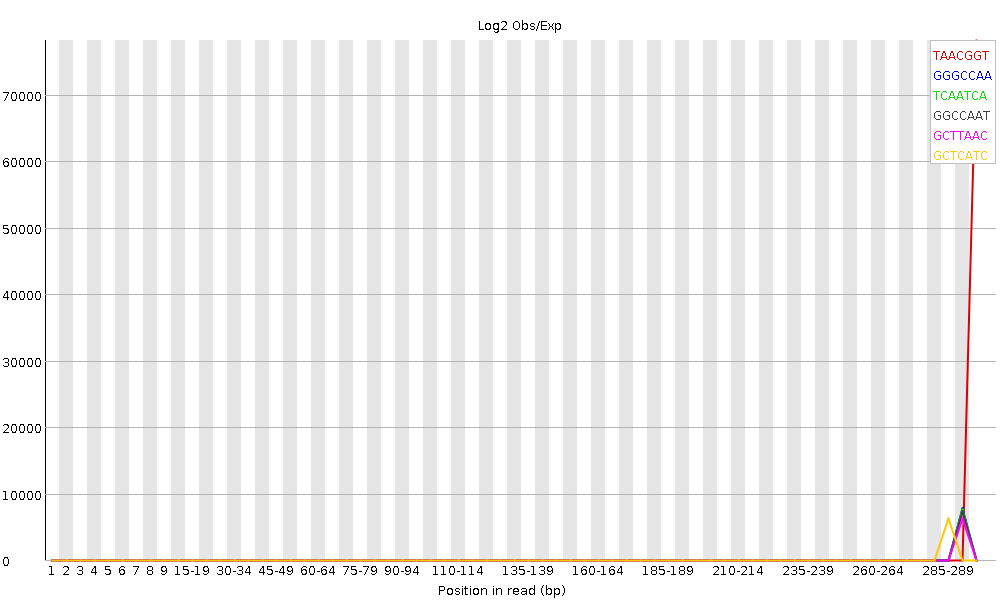
    The fastqc results are significantly poorer than I'm used to. However, I do realise there is considerably different chemistry involved, and fastqc was designed for Illumina, so may not be giving accurate results.

    Nevertheless, the large number of failed components is concerning and I was wondering if anyone experienced with Ion Torrent data can tell me if these results mean the samples need to be re-sequenced or not.

    Click image for larger version

Name:	summary.png
Views:	1
Size:	64.3 KB
ID:	308917

    One of my main concerns, other than quality, is the variable size of the total number of sequences per sample. These vary from 12703948 sequences to 50092930 sequences. Is this normal for Ion Torrent? How can I accurately calculate differential expression with such variable sequences numbers per sample?

    Filename 5C_IonXpressRNA_009_rawlib.basecaller.bam
    File type Conventional base calls
    Encoding Sanger / Illumina 1.9
    Total Sequences 17356006
    Sequences flagged as poor quality 0
    Sequence length 8-352
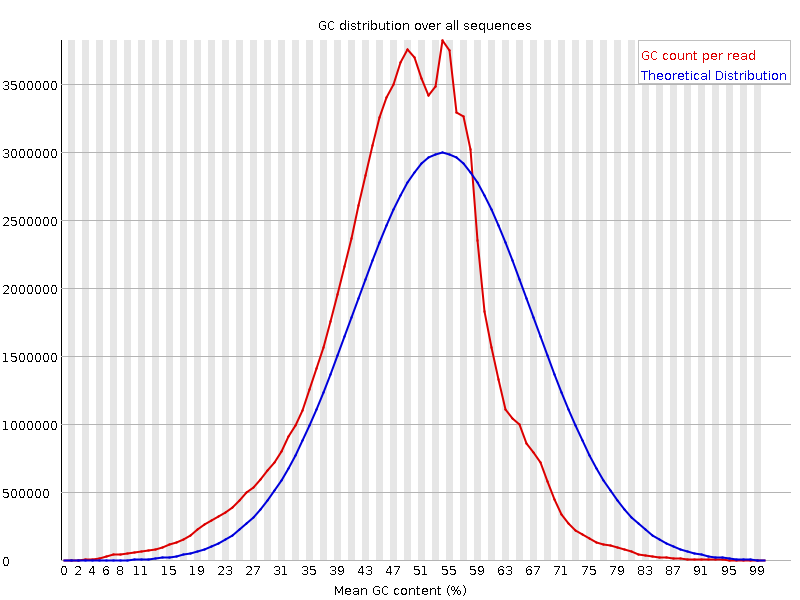
    %GC 48

    Click image for larger version

Name:	per_base_sequence.png
Views:	1
Size:	68.1 KB
ID:	308919

    Click image for larger version

Name:	per_sequence_gc.png
Views:	1
Size:	89.6 KB
ID:	308921

    Click image for larger version

Name:	sequence_duplication.png
Views:	1
Size:	39.0 KB
ID:	308920

    Click image for larger version

Name:	kmer.png
Views:	1
Size:	66.0 KB
ID:	308918

  • #2
    Your data looks pretty normal for Ion Torrent. I do not use proton data since I'm in the low throughput microbe world. There are a couple of things going on here in your question.

    First, your guess about the fastqc values not being equivalent are correct. there is a thread about it here http://seqanswers.com/forums/showthread.php?t=33555 In my experience I have good quality data but my average Q score is in the range of 28-32, it seems to be a "depressed" score. It should be able to show you if your data takes a nose dive however.

    Second the different sample sequences has more to due with the library prep then the tech. In general you make your library, normalize to 100uM ea, and then pool from there. If your samples are way out of balance it's most likely to that step either being skipped or just not done with a lot of accuracy.

    For your differential analysis question, I'm sorry I'm not sure how to help you. I'm not really doing any of that type of work currently. Also there is a lot of information missing about the experiment to really get into it; however if you are doing whole transcriptome sequencing and each sample's library was prepped the same way wouldn't you be comparing some sort of transformed data? Like sample 1 has 2 fold diff and sample 3 has 4 fold diff with same treatment.

    Comment

    Latest Articles

    Collapse

    • seqadmin
      Essential Discoveries and Tools in Epitranscriptomics
      by seqadmin


      The field of epigenetics has traditionally concentrated more on DNA and how changes like methylation and phosphorylation of histones impact gene expression and regulation. However, our increased understanding of RNA modifications and their importance in cellular processes has led to a rise in epitranscriptomics research. “Epitranscriptomics brings together the concepts of epigenetics and gene expression,” explained Adrien Leger, PhD, Principal Research Scientist on Modified Bases...
      Yesterday, 07:01 AM
    • seqadmin
      Current Approaches to Protein Sequencing
      by seqadmin


      Proteins are often described as the workhorses of the cell, and identifying their sequences is key to understanding their role in biological processes and disease. Currently, the most common technique used to determine protein sequences is mass spectrometry. While still a valuable tool, mass spectrometry faces several limitations and requires a highly experienced scientist familiar with the equipment to operate it. Additionally, other proteomic methods, like affinity assays, are constrained...
      04-04-2024, 04:25 PM

    ad_right_rmr

    Collapse

    News

    Collapse

    Topics Statistics Last Post
    Started by seqadmin, 04-11-2024, 12:08 PM
    0 responses
    39 views
    0 likes
    Last Post seqadmin  
    Started by seqadmin, 04-10-2024, 10:19 PM
    0 responses
    41 views
    0 likes
    Last Post seqadmin  
    Started by seqadmin, 04-10-2024, 09:21 AM
    0 responses
    35 views
    0 likes
    Last Post seqadmin  
    Started by seqadmin, 04-04-2024, 09:00 AM
    0 responses
    55 views
    0 likes
    Last Post seqadmin  
    Working...
    X