Seqanswers Leaderboard Ad

Collapse

Announcement

Collapse
No announcement yet.
X
 
  • Filter
  • Time
  • Show
Clear All
new posts

  • Cuffdiff with and without Quantile Normalization

    Hello experts,

    I am following the recently published Nature Protocol guideline for analyzing my RNA-seq runs using tophat-cufflink-cuffmerge-cuffdiff (cufflink.1.3.0). I wanted see whether upper quantile normalization improved my results so I also used the "-N" option for Cuffdiff. But Here are some summaries from the "gene_exp.diff" output files with or without the "-N" option:

    Condition #ok.status Correlation #Significant DE.Sample.1>Sample.2 DE.Sample.2>sample.1
    Without -N 11884 0.6156752 3865 1851 2014
    With -N 11885 0.6139065 4435 1620 2815


    My questions are:

    1. Is it common to see such HUGE variations on the number of significantly DE genes, the numbers of DE sample 1 > sample 2 and sample 2 > sample 1 just for adding this "-N" option?? and since there's such a huge change, which DE gene list should I trust??

    2. I noticed there is also "-N" option for cufflink. So at which step should I use such option, and will using "--total-hits-norm" also advisable?

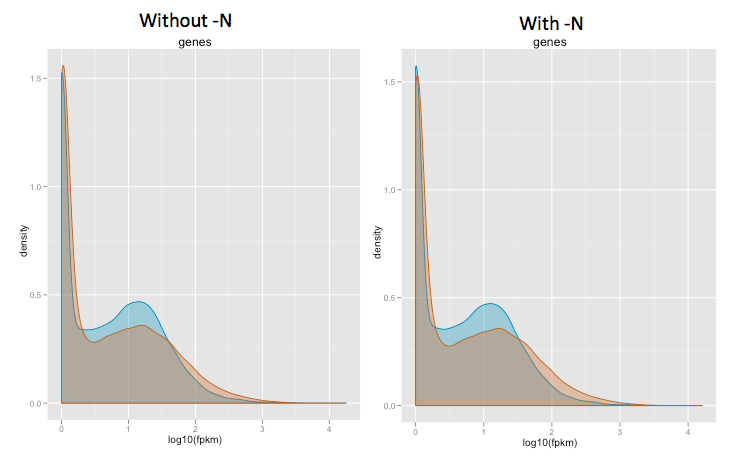
    3. Trying to troubleshoot this, I compare cummeRbund density plots with and without "-N", the density plots doesn't change much at all except at very low log10(RPKM) (See picture) But I thought quantile normalization tries to force the two distributions to be very similar?

    Click image for larger version

Name:	Screen shot 2012-04-06 at 6.56.58 PM.png
Views:	1
Size:	42.5 KB
ID:	307789

    Any comments/helps will be appreciated!!

  • #2
    i guess the biggest and most important step in DE testing is the normalization step. second to that is the variance modeling and finally the statistical test used. if the normalization isn't done properly then every is going to be off. I've had some trouble with cuffdiff's normalization myself though not exactly what you're saying happened to you.

    item 1:
    i think the "normal" in this case depends on the samples. check the log2 fold change values between the two outputs. If you're seeing wildly different fold changes then I'd go with the -N output. this might indicate that read count normalization is introducing some heavy skew in your samples. the quartile normalization is slightly more robust, or so it has been shown (http://www.biomedcentral.com/1471-2105/11/94/)

    2. the gene expression information that comes out of cufflinks wouldn't be used if you are continuing on to use cuffdiff for DE. you'll only use the expression values from cufflinks if you intend to do something with each sample's expressions (like sample clustering). in the Nature pipeline I think the cufflinks step is mostly about getting the "transcripts.gtf" files so you can use cuffmerge and create a customized GTF for your samples.

    3. I think regardless of the normalization you'll see similar gene expression densities since cuffdiff uses some unknown scaling factor post -N normalization to "correct" the FPKM values to make them look like FPKM's calculated "per million mapped reads" style. If you calculate FPKM's "per upper quartile" then you get expressions several orders of magnitude larger than "per million mapped reads". so...i wouldn't expect those density plots to look different.

    As a final check between the normalizations I'd make a scatter plot for each and have a look at those (the csScatter command). Have a look at those plots and make sure the main body of the scatter is more or less centered on the diagonal line that would indicate 1-fold change. If the data is noticeably pulled to one side or the other that would indicate some normalization problems. For an example see my post where I found cuffdiff to blow the normalization if one of my samples has low read depth: http://seqanswers.com/forums/showthread.php?t=19104
    /* Shawn Driscoll, Gene Expression Laboratory, Pfaff
    Salk Institute for Biological Studies, La Jolla, CA, USA */

    Comment

    Latest Articles

    Collapse

    • seqadmin
      Current Approaches to Protein Sequencing
      by seqadmin


      Proteins are often described as the workhorses of the cell, and identifying their sequences is key to understanding their role in biological processes and disease. Currently, the most common technique used to determine protein sequences is mass spectrometry. While still a valuable tool, mass spectrometry faces several limitations and requires a highly experienced scientist familiar with the equipment to operate it. Additionally, other proteomic methods, like affinity assays, are constrained...
      04-04-2024, 04:25 PM
    • seqadmin
      Strategies for Sequencing Challenging Samples
      by seqadmin


      Despite advancements in sequencing platforms and related sample preparation technologies, certain sample types continue to present significant challenges that can compromise sequencing results. Pedro Echave, Senior Manager of the Global Business Segment at Revvity, explained that the success of a sequencing experiment ultimately depends on the amount and integrity of the nucleic acid template (RNA or DNA) obtained from a sample. “The better the quality of the nucleic acid isolated...
      03-22-2024, 06:39 AM

    ad_right_rmr

    Collapse

    News

    Collapse

    Topics Statistics Last Post
    Started by seqadmin, 04-11-2024, 12:08 PM
    0 responses
    25 views
    0 likes
    Last Post seqadmin  
    Started by seqadmin, 04-10-2024, 10:19 PM
    0 responses
    28 views
    0 likes
    Last Post seqadmin  
    Started by seqadmin, 04-10-2024, 09:21 AM
    0 responses
    24 views
    0 likes
    Last Post seqadmin  
    Started by seqadmin, 04-04-2024, 09:00 AM
    0 responses
    52 views
    0 likes
    Last Post seqadmin  
    Working...
    X