 Tweet
Tweet
Hi,
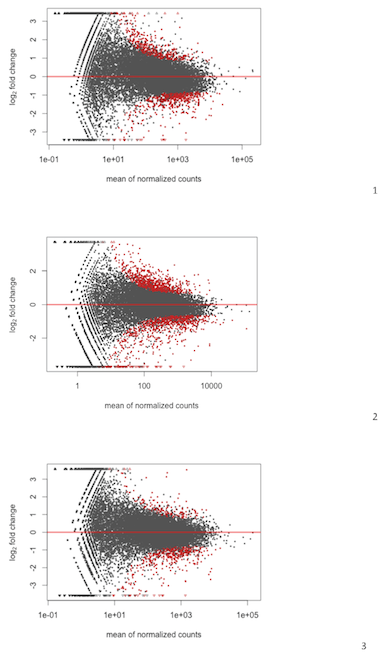
As seen below my MAplots for RNAseq from DESeq are a bit skewed;
To me 2 and 3 are acceptable while no. 1 show clear slope suggesting that there is more upregulation of genes with lower expression and etc.
is this a normalization artifact?
I would appreciate for any suggestion, I tried to estimate dispersions in different ways, also different combination between replicates, still the same...
1.pdf
Comment