Seqanswers Leaderboard Ad

Collapse

Announcement

Collapse
No announcement yet.
X
 
  • Filter
  • Time
  • Show
Clear All
new posts

  • How to analyze these two figures

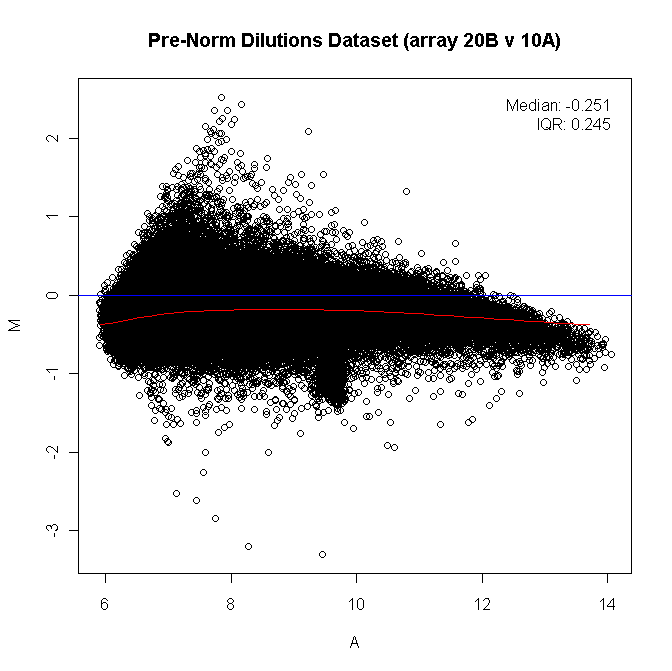
    The figures here showed the gene expression level (log scale) of two female individuals (top) and two male ones (bottom).

    Each spot represented a gene and each axis represented an individual.

    The figures suggested that, generally, genes with lower expression levels were more scattered.

    My question is:

    If the bottom figure (male expression profile) was considered to be the expected trend, how do I find the genes in the female (top figure ) that demonstrated more variable expression between two individuals?

    Thanks for any inputs!!
    Attached Files

  • #2
    I think Wilcoxon test can be used in this case. You apply this test in every gene and check if there are significant differences between groups. Of course do not forget about multiple test correction.

    Comment


    • #3
      @TiborNagy: Testing for rank changes doesn't make sense if you're interested looking at changes in variability. Presumably Capricy is looking for genes with the same average expression between genders but increased variance in females or males.

      @Capricy: There are a number of methods out there for trying to measure changes in variability, but I don't think any of them will work well with N=2 per group.

      Comment


      • #4
        I think it's more appropriate to demonstrate differences like this with a MA plot:


        In other words, plot mean expression on the X axis, and difference on the Y axis. It's generally the case that low expression values will have more variation. I prefer using smoothscatter for this because it makes density changes easier to see than a flat scatter plot:


        With respect to selection, you could use your male graph to generate a fitting curve for the female graph based on a running 95% percentile (or similar), and select the genes that reside outside the curve.

        Comment


        • #5
          @gringer: Could you explain more about how to generating the fitting curve for the graph? Or point me to any script/package I can use?

          Thanks

          And I re-graphed as you suggested: logFoldchange vs log(mean). The plot was attached here.

          The left one is the male and the right one is the female.
          Attached Files

          Comment

          Latest Articles

          Collapse

          • seqadmin
            Current Approaches to Protein Sequencing
            by seqadmin


            Proteins are often described as the workhorses of the cell, and identifying their sequences is key to understanding their role in biological processes and disease. Currently, the most common technique used to determine protein sequences is mass spectrometry. While still a valuable tool, mass spectrometry faces several limitations and requires a highly experienced scientist familiar with the equipment to operate it. Additionally, other proteomic methods, like affinity assays, are constrained...
            04-04-2024, 04:25 PM
          • seqadmin
            Strategies for Sequencing Challenging Samples
            by seqadmin


            Despite advancements in sequencing platforms and related sample preparation technologies, certain sample types continue to present significant challenges that can compromise sequencing results. Pedro Echave, Senior Manager of the Global Business Segment at Revvity, explained that the success of a sequencing experiment ultimately depends on the amount and integrity of the nucleic acid template (RNA or DNA) obtained from a sample. “The better the quality of the nucleic acid isolated...
            03-22-2024, 06:39 AM

          ad_right_rmr

          Collapse

          News

          Collapse

          Topics Statistics Last Post
          Started by seqadmin, 04-11-2024, 12:08 PM
          0 responses
          25 views
          0 likes
          Last Post seqadmin  
          Started by seqadmin, 04-10-2024, 10:19 PM
          0 responses
          28 views
          0 likes
          Last Post seqadmin  
          Started by seqadmin, 04-10-2024, 09:21 AM
          0 responses
          24 views
          0 likes
          Last Post seqadmin  
          Started by seqadmin, 04-04-2024, 09:00 AM
          0 responses
          52 views
          0 likes
          Last Post seqadmin  
          Working...
          X