Seqanswers Leaderboard Ad

Collapse

Announcement

Collapse
No announcement yet.
X
 
  • Filter
  • Time
  • Show
Clear All
new posts

  • different results from fastQC and fastx toolkits

    Hi,

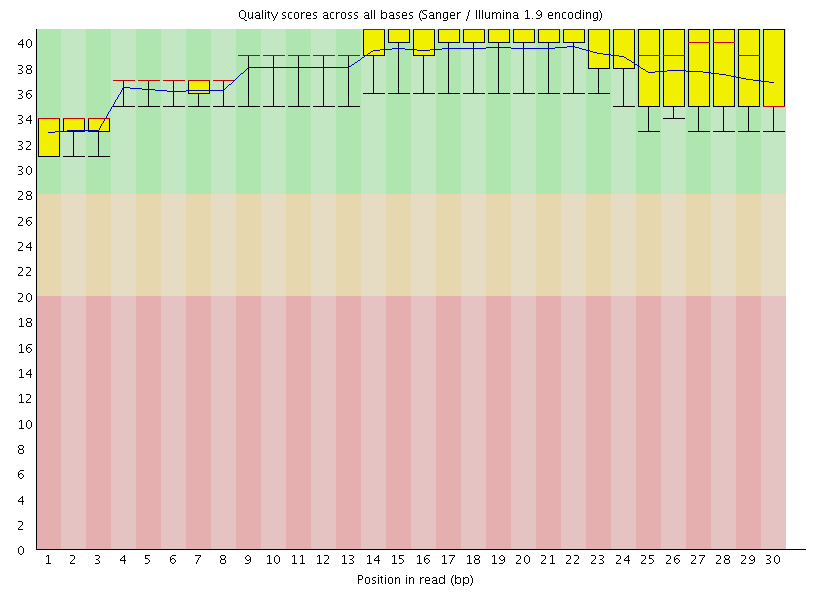
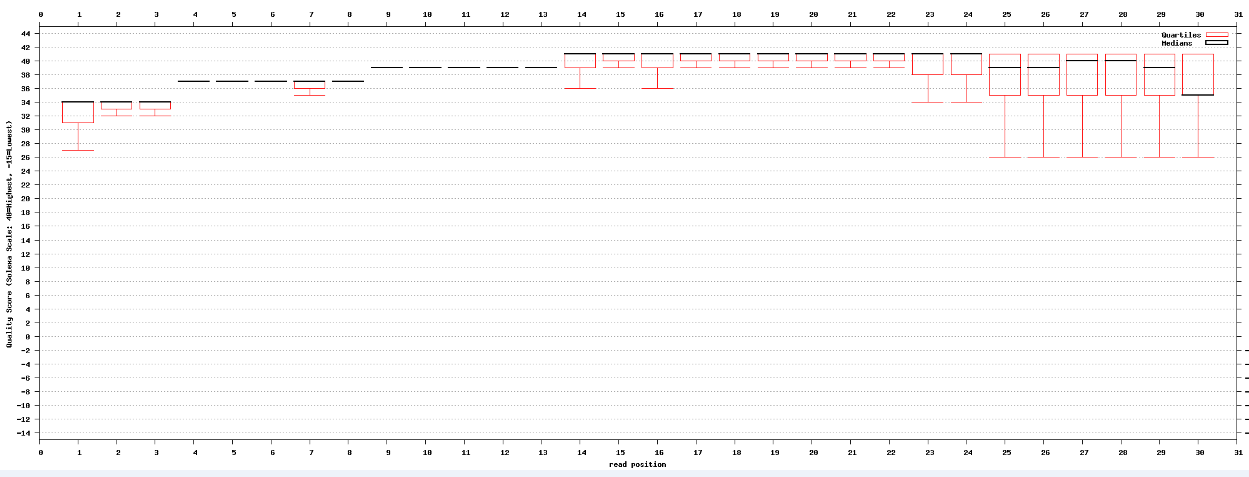
    I am using fastQC to check the quality of my miRNA seq data after adaptor trimming. Then I used fastq_quality_boxplot_graph.sh from fastx toolkits to see if the results are the same as fastQC. Surprisingly, it seems that with fastq_quality_boxplot_graph.sh, the quality scores are lower (some below 30) whereas they are all above 30 using fastQC.

    Could anybody tell me why there is so big difference?

    There is another thread:
    Discussion of next-gen sequencing related bioinformatics: resources, algorithms, open source efforts, etc


    But in my case, I believe that all the reads have been read by fastQC or fastq_quality_boxplot_graph.sh, which can be known from their statistics.

    There is indeed a very small percentage of reads which contain N. Could that be the problem? I am looking for some tools to get rid of the reads with N.

    Attached are the results from fastQC and fastq_quality_boxplot_graph.sh. Thanks.
    Click image for larger version

Name:	fastqc.png
Views:	1
Size:	37.0 KB
ID:	308157Click image for larger version

Name:	fastx_tool.png
Views:	1
Size:	19.7 KB
ID:	308158

  • #2
    Fastqc is smart and detected that your quality encoding. Fastq_quality_boxplot is not smart and didn't detect your encoding. As such, the later is plotting your scores on the solexa quality scale...hence values below zero.

    Comment


    • #3
      try http://edwards.sdsu.edu/cgi-bin/prinseq/prinseq.cgi

      Comment


      • #4
        Originally posted by JackieBadger View Post
        Fastqc is smart and detected that your quality encoding. Fastq_quality_boxplot is not smart and didn't detect your encoding. As such, the later is plotting your scores on the solexa quality scale...hence values below zero.

        http://en.wikipedia.org/wiki/FASTQ_format
        Hi,
        Thanks for your reply. The input of Fastq_quality_boxplot is the text file produced by fastx_quality_stats. I have specified -Q33 in fastx_quality_stats to get the test file. In this way, the encoding should be detected. And do you mean that results from fastQC are more reliable?

        Comment


        • #5
          Take a look at what the program actually does.

          "FASTQ Quality Chart

          $ fastq_quality_boxplot_graph.sh -h
          Solexa-Quality BoxPlot plotter
          Generates a solexa quality score box-plot graph "

          So unless you have Solexa encoding, its no use to you.

          FastqToolkit is glitchy and kind of out dated..... people have re-written many of the functions to perform better
          Last edited by JackieBadger; 06-18-2013, 10:49 AM.

          Comment


          • #6
            Originally posted by JackieBadger View Post
            Take a look at what the program actually does.

            "FASTQ Quality Chart

            $ fastq_quality_boxplot_graph.sh -h
            Solexa-Quality BoxPlot plotter
            Generates a solexa quality score box-plot graph "

            So unless you have Solexa encoding, its no use to you.

            FastqToolkit is glitchy and kind of out dated..... people have re-written many of the functions to perform better
            Ok, thanks.

            Comment

            Latest Articles

            Collapse

            • seqadmin
              Essential Discoveries and Tools in Epitranscriptomics
              by seqadmin


              The field of epigenetics has traditionally concentrated more on DNA and how changes like methylation and phosphorylation of histones impact gene expression and regulation. However, our increased understanding of RNA modifications and their importance in cellular processes has led to a rise in epitranscriptomics research. “Epitranscriptomics brings together the concepts of epigenetics and gene expression,” explained Adrien Leger, PhD, Principal Research Scientist...
              04-22-2024, 07:01 AM
            • seqadmin
              Current Approaches to Protein Sequencing
              by seqadmin


              Proteins are often described as the workhorses of the cell, and identifying their sequences is key to understanding their role in biological processes and disease. Currently, the most common technique used to determine protein sequences is mass spectrometry. While still a valuable tool, mass spectrometry faces several limitations and requires a highly experienced scientist familiar with the equipment to operate it. Additionally, other proteomic methods, like affinity assays, are constrained...
              04-04-2024, 04:25 PM

            ad_right_rmr

            Collapse

            News

            Collapse

            Topics Statistics Last Post
            Started by seqadmin, Yesterday, 08:47 AM
            0 responses
            14 views
            0 likes
            Last Post seqadmin  
            Started by seqadmin, 04-11-2024, 12:08 PM
            0 responses
            60 views
            0 likes
            Last Post seqadmin  
            Started by seqadmin, 04-10-2024, 10:19 PM
            0 responses
            60 views
            0 likes
            Last Post seqadmin  
            Started by seqadmin, 04-10-2024, 09:21 AM
            0 responses
            54 views
            0 likes
            Last Post seqadmin  
            Working...
            X