Thanks for the clarification, and thanks for sharing your data!
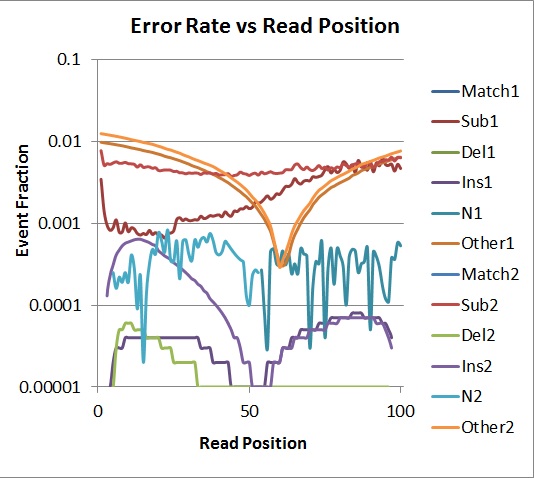
I did some mapping of the first 16m reads, and generated the following graphs:

The "Other" category refers to soft-clipped bases, which is very high in this case because PhiX is small so many of the reads went off the end (*Considering these reads have been adapter-trimmed, I have no idea what is being sequenced past the ends of the PhiX genome; it might be interesting to investigate). Overall the average error rate is below 1% but above 0.1% across the read. Read 2 has a higher-than-expected insertion rate in the first half of the read. Oddly, R2 has some Ns only in the first half, and R1 has some Ns only in the second half. Unlike other platforms, the error rate for R2 seems fairly flat across the read.

This is a different way of looking at the same data.

The quality accuracy graph indicates that again the Q-scores are binned, and like NextSeq V1, they are highly inflated. Over 70% of the bases were assigned Q41, but the average observed quality for Q41 bases was actually Q31.

The insert size distribution is fairly interesting for a couple reasons. It looks like the platform can probably handle inserts over 450bp fairly well; there were some short inserts, but they did not overwhelmingly out-compete the long ones. But the flat distribution of the short-insert tail is odd.
Lastly, it's worth noting that around 83% of the reads mapped to the reference with no mismatches or indels.
For comparison, I've attached the mhist of a 2x150bp HS2500 run (not on PhiX), below. To me the HS2500 looks better, but not drastically better, in terms of error rates.

I did some mapping of the first 16m reads, and generated the following graphs:
The "Other" category refers to soft-clipped bases, which is very high in this case because PhiX is small so many of the reads went off the end (*Considering these reads have been adapter-trimmed, I have no idea what is being sequenced past the ends of the PhiX genome; it might be interesting to investigate). Overall the average error rate is below 1% but above 0.1% across the read. Read 2 has a higher-than-expected insertion rate in the first half of the read. Oddly, R2 has some Ns only in the first half, and R1 has some Ns only in the second half. Unlike other platforms, the error rate for R2 seems fairly flat across the read.
This is a different way of looking at the same data.
The quality accuracy graph indicates that again the Q-scores are binned, and like NextSeq V1, they are highly inflated. Over 70% of the bases were assigned Q41, but the average observed quality for Q41 bases was actually Q31.
The insert size distribution is fairly interesting for a couple reasons. It looks like the platform can probably handle inserts over 450bp fairly well; there were some short inserts, but they did not overwhelmingly out-compete the long ones. But the flat distribution of the short-insert tail is odd.
Lastly, it's worth noting that around 83% of the reads mapped to the reference with no mismatches or indels.
For comparison, I've attached the mhist of a 2x150bp HS2500 run (not on PhiX), below. To me the HS2500 looks better, but not drastically better, in terms of error rates.
Comment