 Tweet
Tweet
Hello,
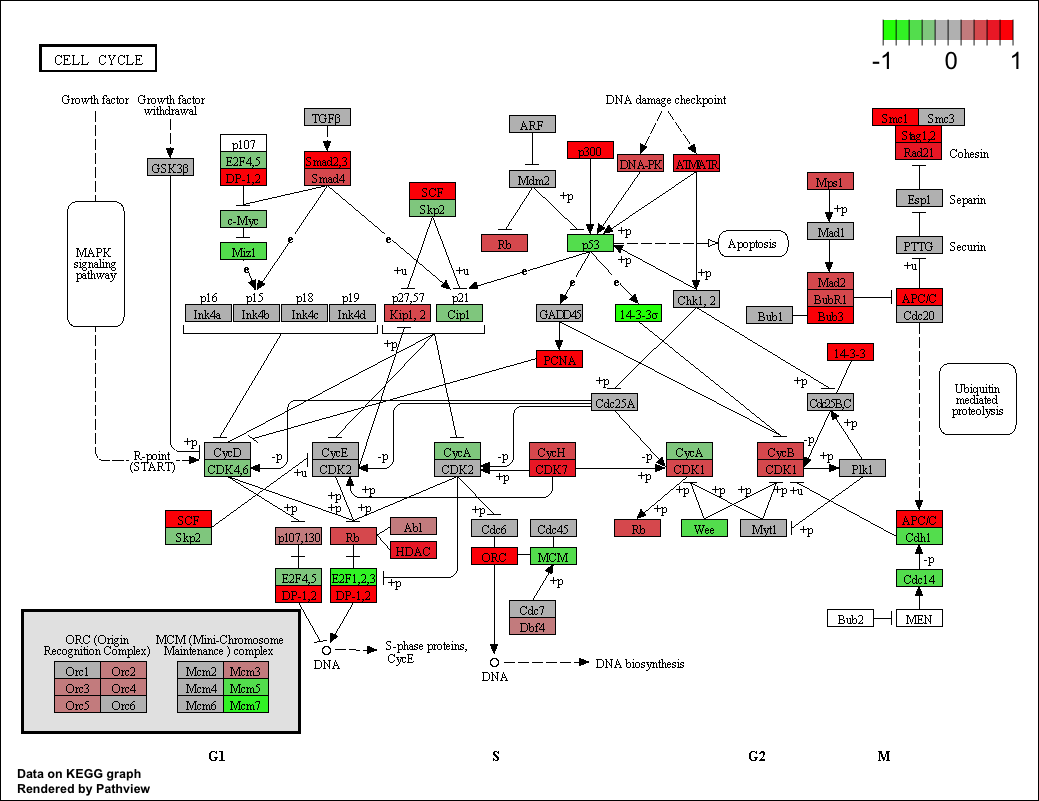
What's the exact meaning of color spectra in pathview R package?
I used the "pathview" function on a list of gene IDs, everything is ok but i can't interpret the colors in the resulted graph.
in the function help, i have this :
low, mid, high each:
is a list of two colors with "gene" and "cpd" as the names. This argument
specifies the color spectra to code gene.data and cpd.data. When data are 1
directional (TRUE value in both.dirs), only mid and high are used to specify the
color spectra. Default spectra (low-mid-high) "green"-"gray"-"red" and "blue"-
"gray"-"yellow" are used for gene.data and cpd.data respectively. The values for
’low, mid, high’ can be given as color names (’red’), plot color index (2=red),
and HTML-style RGB, ("\#FF0000"=red)
link:
just wanted to know what does it means when i have "high" (red color) in my graph
sorry if it seems to be stupid question for some of you
cheers
Samad
What's the exact meaning of color spectra in pathview R package?
I used the "pathview" function on a list of gene IDs, everything is ok but i can't interpret the colors in the resulted graph.
in the function help, i have this :
low, mid, high each:
is a list of two colors with "gene" and "cpd" as the names. This argument
specifies the color spectra to code gene.data and cpd.data. When data are 1
directional (TRUE value in both.dirs), only mid and high are used to specify the
color spectra. Default spectra (low-mid-high) "green"-"gray"-"red" and "blue"-
"gray"-"yellow" are used for gene.data and cpd.data respectively. The values for
’low, mid, high’ can be given as color names (’red’), plot color index (2=red),
and HTML-style RGB, ("\#FF0000"=red)
link:

just wanted to know what does it means when i have "high" (red color) in my graph
sorry if it seems to be stupid question for some of you
cheers
Samad
Comment